 MetaTrader 5
 Experts
 Indicators
 Libraries
 Utilities
 Widgets
 Rules
Watch the Market tutorial videos on YouTube
How to buy а trading robot or an indicator
Run your EA on
virtual hosting
virtual hosting
Test аn indicator/trading robot before buying
Want to earn in the Market?
How to present a product for a sell-through
Technical Indicators for MetaTrader 5 - 215
 Signals from technical indicators play a crucial role in opening and closing deals on stock and Forex markets. The essence of indicators is a mathematical transformation of a financial symbol price aimed at forecasting future price changes.
Test technical indicators to better predict market behavior and profit from it.

# Pin Bar Rejection Scanner - Rejection where it matters
*Category: Pattern Recognition | Difficulty: intermediate | Window: chart window (overlaid on price) | Markets: Universal (Forex, indices, commodities, crypto, stocks) | Suggested timeframes: M15, M30, H1, H4, D1*
## Short description
> Recognises bars with a dominant wick but flags them only when they are significant in absolute terms and occur at a recent extreme.
## Full description
### Overview
A bar with a very long wick tells

# Three Bar Structure Map - Geometry without thresholds
*Category: Pattern Recognition | Difficulty: beginner | Window: separate window below the chart | Markets: Universal (Forex, indices, commodities, crypto, stocks) | Suggested timeframes: M15, M30, H1, H4, D1*
## Short description
> Classifies every three bar group into four geometric configurations, using no arbitrary threshold: two bars either exceed each other or they do not.
## Full description
### Overview
Every group of three co
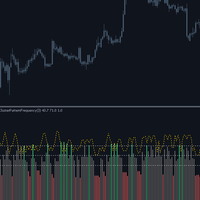
# Cluster Pattern Frequency - Eight sequences and their statistics
*Category: Pattern Recognition | Difficulty: advanced | Window: separate window below the chart | Markets: Universal (Forex, indices, commodities, crypto, stocks) | Suggested timeframes: M30, H1, H4, D1*
## Short description
> Encodes every three bar sequence into one of eight possible configurations and measures the historical frequency of it being followed by an upward move.
## Full description
### Overview
Every three b

Level Reaction plots support and resistance levels from the higher timeframe and marks two kinds of price reaction to them: a breakout continuation and a reversal at the level. It works on any symbol and any timeframe available in your terminal. How the levels are built At the start of each higher-timeframe bar, the indicator takes the prior bar's high, low and close and derives five resistance levels and five support levels around that close. The spacing between levels adapts to how wide the pr

# Momentum Thrust Pattern - Thrust, pause, resumption
*Category: Pattern Recognition | Difficulty: intermediate | Window: chart window (overlaid on price) | Markets: Universal (Forex, indices, commodities, crypto, stocks) | Suggested timeframes: M15, M30, H1, H4, D1*
## Short description
> Recognises the thrust, contained pause and resumption beyond the extreme sequence, signalling only once all three phases have completed.
## Full description
### Overview
Directional moves almost always

# Higher Timeframe Bias - The higher timeframe without deception
*Category: Multi Timeframe Hybrids | Difficulty: intermediate | Window: separate window below the chart | Markets: Universal (Forex, indices, commodities, crypto, stocks) | Suggested timeframes: M5, M15, M30, H1, H4*
## Short description
> Brings a higher timeframe direction onto the current chart using only already closed bars, avoiding the most insidious form of repaint.
## Full description
### Overview
Multi timeframe ind

This draws fewer zones than the free order block indicators do. That's the whole point, and it's worth saying before you look at a screenshot and decide something is broken. On the gold chart I grabbed while writing this, the engine found 54 points of interest and marked 2 as tradeable. The other 52 sit on the chart only if you ask for them, greyed out and labelled what the material calls them: traps. Why it draws less than everything else Every order block tool I've used marks every block. Scro

An indicator that marks support and resistance areas by counting how many separate times price has returned to them. Every counted return is marked on the chart, so the count can be checked against the chart history.
What it draws Elektra Look Left draws two zones. One below price, for buys. One above price, for sells. Nothing else is added to the chart. Each zone is drawn as a rectangle rather than a single line. The height of the rectangle is the measured spread of the swings that formed

Introducing my indicator in Meta Trader 5. Trading212 export analysis and charting and exporting to csv. This indicator is an independent development and has no official connection with Trading212 (Trading 212 Markets Ltd.). https://www.youtube.com/watch?v=_hzdqUJgwo4
Hungary: Meta Trader 5 ben indikátorom bemutatása. Trading212 export elemzése és chartra kiíratása és csv.-be exportálása. Ez az indikátor egy független fejlesztés, és semmilyen hivatalos kapcsolatban nem áll a Trading212 vállalat

Trendline MachineGun MT5 Trendline MachineGun is an automatic support and resistance trendline scanner designed for traders who want structured chart analysis without manually drawing and comparing numerous trendlines. The indicator detects confirmed swing highs and swing lows, constructs multiple trendline candidates, evaluates their strength, removes lines that are too similar, and keeps the most relevant structures visible on the chart. The default display is limited to eight ranked trendline
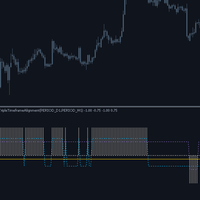
# Triple Timeframe Alignment - Three horizons, one score
*Category: Multi Timeframe Hybrids | Difficulty: intermediate | Window: separate window below the chart | Markets: Universal (Forex, indices, commodities, crypto, stocks) | Suggested timeframes: M5, M15, M30, H1, H4*
## Short description
> Checks whether current, middle and higher timeframes point the same way, showing both the overall score and each horizon direction.
## Full description
### Overview
Full alignment of the three tim

# HTF Level Projector - The levels everyone watches
*Category: Multi Timeframe Hybrids | Difficulty: beginner | Window: chart window (overlaid on price) | Markets: Universal (Forex, indices, commodities, crypto, stocks) | Suggested timeframes: M5, M15, M30, H1, H4*
## Short description
> Projects onto the current chart the high, low and close of the last complete higher period, updating only on period close.
## Full description
### Overview
Yesterday high and low are shared references, no

# Timeframe Divergence Monitor - When horizons disagree
*Category: Multi Timeframe Hybrids | Difficulty: intermediate | Window: separate window below the chart | Markets: Universal (Forex, indices, commodities, crypto, stocks) | Suggested timeframes: M5, M15, M30, H1, H4*
## Short description
> Measures the momentum disagreement between current and higher timeframes, highlighting phases where the two horizons move in opposite directions.
## Full description
### Overview
When the current t

# Volume Support Resistance Map - Supports and resistances drawn by volume
*Category: Experimental | Difficulty: intermediate | Window: chart window (overlaid on price) | Markets: Universal (Forex, indices, commodities, crypto, stocks) | Suggested timeframes: M15, M30, H1, H4, D1*
## Short description
> Horizontal bars drawn on the chart, long in proportion to the volume traded at each level: above price the selling volume marking resistances, below it the buying volume marking supports.
##

Here is the description translated and optimized for the MQL5 Market : Candle Timer Jason – Candle Countdown Indicator (MT5) Candle Timer Jason is a lightweight, high-performance utility developed for MetaTrader 5. It is designed for Forex, Stock, and Crypto traders who need to monitor the exact remaining time before the current candle closes. Knowing precisely how many minutes and seconds are left in a bar is essential for execution timing, helping you avoid premature entries or getting caught

️ Candle Timer Advanced Suite Glass 3D effect for MetaTrader 5
Gain the ultimate edge in precision timing with the Candle Timer Advanced Suite. This is not just a simple countdown; it is a professional-grade analytical tool designed to keep you perfectly synchronized with the market, ensuring you never miss a critical entry or exit due to server lag or misinterpretation. Built specifically for MetaTrader 5, this suite offers unparalleled flexibility, allowing you to visualize time exactly how

Cross Over Trend – EMA/SMA Crossover Indicator Cross Over Trend is a simple and effective technical indicator for MetaTrader 5 that visualizes the relationship between an Exponential Moving Average (EMA) and a Simple Moving Average (SMA) . The indicator makes trend direction easier to identify by automatically separating the chart into UpTrend and DownTrend phases based on the EMA/SMA crossover. How It Works The indicator compares the current values of the selected EMA and SMA: EMA > SMA → UpTre
VWAP Deviation Indicator
The VWAP Deviation Indicator is a volume-weighted price analysis tool designed to identify the current price's relationship to a dynamically calculated VWAP basis and its deviation levels. Unlike a simple moving average, this indicator incorporates tick volume weighting , allowing the VWAP calculation to give greater importance to price levels associated with higher trading activity. The indicator displays a central VWAP Basis together with 2x and 3x deviation bands ,

VWAP Analytics Advanced Suite for MetaTrader 5
Gain institutional-grade market insight with the VWAP Analytics Advanced Suite , a professional Volume Weighted Average Price indicator built exclusively for MetaTrader 5. This tool goes beyond a simple VWAP line; it is a complete analytical ecosystem designed to identify trend bias, measure market deviation, and provide high-probability entry and exit signals with precision timing. Whether you are a day trader, scalper, or swing trader, this su

Spread & Broker Server Analytics Advanced Suite Glass 3D effect for MetaTrader 5 ( Dashboard & compact dashboard)
Master the fundamental mechanism of market liquidity with the Spread Analytics Advanced Suite, a professional-grade monitoring and alert tool built exclusively for MetaTrader 5. In modern trading, the Bid-Ask spread is your primary transaction cost. This suite provides the transparency and precision required to manage these costs effectively, ensuring you trade only when conditio

Moment Analytics: Confluence Dashboard Advanced Suite for MetaTrader 5
Gain an unparalleled edge in market timing and trend confirmation with the Moment Analytics Confluence Dashboard , a professional-grade analytical suite built exclusively for MetaTrader 5. This tool consolidates nine of the most powerful momentum and volatility indicators into a single, cohesive on-chart HUD (Heads-Up Display), eliminating chart clutter and providing instant, at-a-glance confluence signals. Whether you ar

Price Alerts Advanced Suite for MetaTrader 5
Take control of your trading execution with the Price Alerts Advanced Suite , a professional-grade technical analysis tool built exclusively for MetaTrader 5. This suite goes far beyond simple horizontal lines; it is a complete analytical ecosystem designed to identify key market levels, monitor price action in real-time, and deliver instant notifications across multiple channels. Whether you are a day trader, swing trader, or algorithmic develope

Bollinger Trend Signals MT5 - is a trend indicator based on Bollinger Bands. All signals are generated without repainting or lag. It identifies the directional trend channel, potential entry points, and possible exit points for trades.
How the indicator works
The indicator functions by combining a trend channel with a system that identifies price peaks and troughs.
The blue line represents the main smoothed trend line; when it is above the price, the trend channel is bearish, and when it is b

An indicator that assembles a comprehensive system from standard indicators and immediately backtests it against historical chart data. It features a matrix of 16 indicators across 9 timeframes: clicking a cell adds that indicator/timeframe combination to the set; the combination "votes," and a signal is generated once the voting threshold is met. Statistics are recalculated whenever the composition changes, covering results, trade count, win rate, profit factor, expectancy, and drawdown. A gen

MTF LRMA Plus: Multi-Timeframe Trading Decision System Linear Regression Moving Average with ADX Trend Strength Analysis Across 6 Timeframes Product Overview MTF LRMA Plus is a professional-grade trading indicator that combines Linear Regression Moving Average (LRMA) trend analysis with ADX (Average Directional Index) trend strength measurement across 6 key timeframes (D1, H4, H1, M30, M15, M5). It delivers actionable insights through an intuitive visual dashboard, helping traders identify h

GOLDEN CROSS V1.0 - Moving Average Crossover Indicator with Quality Score General Description The GOLDEN CROSS is an advanced technical indicator developed for MetaTrader 5 that combines moving average crossovers with a quality scoring system based on multiple technical filters. It is designed to identify high-probability entry points, offering traders interactive visual tools and comprehensive risk management features. Indicator Structure and Logic 1. Crossover System Fas

KITO Opportunity ATLAS
MARKET OPPORTUNITY INTELLIGENCE FOR MT5 The market rarely suffers from a shortage of signals. The real challenge is knowing which opportunities deserve your attention—and which ones deserve to be ignored. Kito Atlas transforms your MetaTrader 5 terminal into a multi-market opportunity command centre. From one compact dashboard, it scans multiple symbols and timeframes, compares several forms of market evidence, ranks the strongest opportunities and opens a structured price

This custom algorithmic indicator is a zero-lag, non-repainting trading tool engineered for precision entries. By fusing a proprietary combination of momentum and structural metrics behind the scenes, it identifies immediate market exhaustion points without relying on delayed data. Because it calculates and locks its logic the exact millisecond a bar closes, signals will never shift, lag, or repaint after the fact.
Execution & Trade Management:
The One-Candle Rule: The primary execution strate

QQE Signal – Quantitative Qualitative Estimation Indicator
QQE Signal is a powerful oscillator-based technical indicator for MetaTrader 5 designed to help traders identify potential trend changes and momentum shifts using a combination of a smoothed RSI and a dynamically calculated QQE signal line. The indicator provides a clear visual representation of the relationship between the blue RSI-based signal line and the black dotted smoothed QQE line , combined with the important 50 level . Key Fea

MA Flow No.2 See the Flow of Bulls & Bears at a Glance, and Keep the Rhythm of the Market in Your Hands
Tired of staring at dozens of moving averages until your eyes blur? Unsure when to enter, or where to place your stop? MA Flow No.2 upgrades the humble moving average into a complete trend-trading system. No more scattered lines on your chart — instead, a living "river of bulls and bears". Up to 100 moving averages roll together in real time. On every single bar, you can see at a glance w

Volume Footprint is a per-price-level order flow indicator for MetaTrader 5. Instead of a single candle, each bar is broken down into individual price rows showing bid and ask volume traded at that level — so you see exactly where buyers and sellers transacted inside the bar, not just where price closed. The indicator aggregates the chart's tick feed on a lower timeframe (auto-selected relative to the chart period, or fixed manually) and classifies each tick as bid- or ask-side using MetaTrader'

Sultan of Swing Sultan of Swing is a clean and reliable swing-based signal indicator designed for traders who want clear entries without confusion or lag. The indicator detects price swings and delivers signals only at the open of a new bar. sometimes mid-bar signals but no repainting, and no unnecessary noise. Key Features Non-repainting – Signals stay fixed always. New bar signals only – Alerts appear at the start of the candle, sometimes in the Middle. Price swing logic – Built purely on mar

DaySwingPro Institutional — Multi-Factor Day & Swing Trading Engine Confluence-based BUY/SELL signals with institutional risk management, Smart Money Concepts and a live HUD — engineered with a strict zero-repaint architecture. What is it for? DaySwingPro Institutional is built for day and swing traders who hold positions from one day to several weeks (recommended timeframes: H1, H4, D1 ). Instead of firing arrows on every minor fluctuation, it waits for the trend, momentum and mark

An arrow tells you to buy. Obsidian Scalper Pro tells you where to buy, where the stop goes, where the three targets are, how big the position should be for your risk, and how good the setup is out of 100. Every signal arrives as a finished trade plan drawn on the chart, and a built in statistics window shows the honest result of the last hundred of them, win rate with a confidence interval and all. Every decision is made on a closed bar, so the history you are looking at is the history you woul

A liquidity pool is a confirmed swing high or swing low that has not yet been taken. A liquidity sweep is the bar on which price trades beyond that level and then closes back inside the range - the same event traders also call a stop hunt, a stop run, a liquidity grab or a false breakout. Liquidity Sweep Pools MTF marks both the pools and the liquidity sweeps taken on them, on the current chart and on a higher timeframe you choose, and adds a live panel of active pools, a volume filter on pool f

Supply and Demand + Market Structure Smart Money order block detection, volume-weighted confirmation, and full BOS/CHoCH market structure Check out Rudy Bank for more features: https: // www.mql5.com/en/market/product/193059 Check out Iron Entry for zone entry confirmations: https: // www.mql5.com/en/market/product/193937
Overview
SupplyDemand Edge finds and draws institutional supply and demand order blocks directly on your chart, then backs every one of them up with real market data — volume

See the Market From the Higher-Timeframe Perspective. Ashinton MTF-Trend Pro is a professional multi-timeframe trend analysis indicator for MetaTrader 5, designed to help traders quickly identify directional alignment across Monthly (MN1), Weekly (W1), Daily (D1), and H4 timeframes.
Instead of analyzing each timeframe manually, MTF-Trend Pro brings the bigger market picture into one clean, intuitive dashboard, helping you determine whether the higher timeframes are aligned, conflicted, or deve

ElliottWave Pro — Automatic Wave 2 Detection and Wave 3 Targets An indicator for MetaTrader 5 that automates Elliott Wave and Fibonacci analysis. ElliottWave Pro detects the end of the first impulse (Wave 1), calculates the corrective zone (Wave 2) and draws a ready-to-use trading setup with Stop Loss and Take Profit levels. Key Features Automatic Wave 1 detection: connects points P0 and P1 to show the trend structure. Wave 2 entry zone: a rectangular retracement zone with Fibonacci levels 38.2%

SMC Sentinel — Smart Money Concepts Indicator Trade with structure. See the market differently. SMC Sentinel is an advanced Smart Money Concepts (SMC) analysis indicator for MetaTrader 5 designed to bring multiple price-action concepts together in one clean, customizable charting system. Instead of relying on a single signal, SMC Sentinel analyzes market structure, liquidity, price imbalances, institutional zones, retracement areas and trend context to help traders understand where price is comi

Trend Market — Smart Money Concepts (SMC) Indicator with Order Blocks, FVG & Auto TP System Trend Market is a complete Smart Money Concepts toolkit built to help you read institutional price behavior with clarity — market structure, liquidity zones, and precise risk-based profit targets, all in one indicator. The Strategy This indicator is built around real Smart Money Concepts (SMC) trading logic: Market Structure Detection (BOS / CHoCH) — Using fractal-based swing analysis, the indicator auto

LM Portfolio Analytics MT5 LM Portfolio Analytics MT5 displays closed-trade performance statistics and an equity curve directly on the MetaTrader 5 chart. The indicator reads the account’s available closed-deal history and organises the results into a compact on-chart dashboard. It can analyse a selected magic number, all available magic numbers, or configured EA groups. Two dashboard views are available: Statistics Equity Curve Three analysis scopes are available: Single Magic All Magics EA Gro

Stop Watching Trend Lines. Get Alerted. Trend Line Alert automatically monitors your diagonal trend lines and alerts you when price closes above, closes below, or touches the line . Go beyond a basic trend-line alert with candle and price-action confirmation designed to help you focus on higher-quality setups. KEY FEATURES Close Above Trend Line
Get alerted when a qualifying candle closes above your trend line. Close Below Trend Line
Detect bearish breaks when price close

SweepReversalMap — Liquidity Sweep Reversal Zone Mapper Overview SweepReversalMap is a price-action-based custom indicator that detects "Liquidity Sweep" events and maps potential reversal zones once price reclaims the swept level. It works on any symbol and timeframe. Core Logic Pivot Detection : Identifies the most recent valid swing high/low based on user-defined Swing Length. Sweep Trigger : When price penetrates the swing high (or low) by at least the ATR-filtered minimum penetration thres

This one draws almost nothing most days, and I'd rather you knew that before you look at a screenshot and decide it's broken. Here's a number from my own machine. I ran it across four symbols and two timeframes, sixteen charts, looking at the last 300 bars of each. It drew a model on five of them. That's the trade the tool makes: a full chain of breaks, a structure shift that closes, and a pullback all the way back to the block at the root of the move. Three things, in that order, or nothing get

Bjorgum Key Levels (Bj Key Levels) MT5
Multi-timeframe support/resistance indicator that builds automatic price zones around pivot points — not just single lines. Zones are dynamic: width adapts to current volatility (ATR), every touch is counted, and each zone has its own life cycle — age, max touches, breakout, or role reversal.
Key features
- **Automatic S/R zones from pivots** — pivot lookback is configurable (default 7 bars left / 7 bars right) - **Volatility-adaptive width** — zone wi

HubDynamicTrendLine This indicator identifies strict pivot highs and lows based on N bars to the left and right (default 15), connecting consecutive pivots of the same type to build a dynamic channel with upper and lower boundaries. Key Features Pivot Connections : Consecutive pivot highs and pivot lows are connected with solid trend lines, forming a visible channel structure. Slope Projection : When the price difference between two consecutive pivots of the same type is at least one 200-period

Overview ATOM MultiMA Intelligence Dashboard is a professional-grade technical analysis tool designed for trend-following and breakout traders. By combining a multi-layered Exponential Moving Average (EMA) framework with a dynamic "Energy Bar" momentum filter, this indicator helps you filter out market noise and focus exclusively on high-probability setups. Whether you trade Forex, Gold (XAUUSD), or Indices, this indicator gives you a clean, real-time command center right on your chart. Key Feat

Pro_Multi_Timeframe_SR_Zones.mq5 — Description A multi-timeframe support/resistance (S/R) indicator for MetaTrader 5. The name is Pro_Multi_Timeframe_SR_Zones. It draws support and resistance price zones (rectangles) on the chart, found on 8 higher timeframes, with lines in the center of the zone, strength labels (hits), and control buttons. The file header states "Version 6.02 (Enhanced)," and #property version states 6.07.
What the indicator does Scans 8 higher timeframes: M5, M15, M30, H1,

Double Stochastic Advanced Suite for MetaTrader 5 Take your oscillator analysis to the next level with the Double Stochastic Advanced Suite . Moving beyond the standard single stochastic, this professional tool allows you to visualize the interaction between two independent stochastic indicators simultaneously. Designed to identify high-probability turning points, this suite excels at highlighting Convergence (when both oscillators agree) and Divergence (when oscillators disagree with price a

Crypto Minior — 30-Engine Confluence Command Center for MetaTrader 5 MT4 Version : https://www.mql5.com/en/market/product/194508 A full trading dashboard built into a single chart indicator. Crypto Minior turns your MT5 chart into a 7-page command center that reads 30 technical engines across trend, momentum, and order-flow, distills them into one clear verdict, and lays out an entry/stop/target plan — all without a single extra window. Built with crypto pairs in mind, but works on any symbol M

Pivot Hunter Trend Reversal is an advanced technical indicator that executes complex mathematical analysis in real-time through its algorithm—a level of data processing and instant calculation that would be impossible for a human to perform manually with the same speed and precision. The tool is grounded in Elliott wave theories and the institutional VWAP indicator to identify the end of corrections (pullbacks) and the resumption of the primary trend. How the reading works: Green Arrow (Buy): In

High Probability Trade Signal Scanner
The Concept
This isn't your average indicator. The High Probability Trade Signal Scanner is a fully automated multi-timeframe surveillance system that hunts for institutional-grade setups across your entire Market Watch. It doesn't just display pretty lines - it identifies moments when smart money is likely to have left their footprints in the market.
How It Works
The Institutional DNA
Markets move because liquidity needs to be filled. Banks and instit

Multi-Levels Trade Setup Scanner Pro - Professional User Guide
The Philosophy Behind This Indicator
This is not just another MT5 indicator that paints pretty colors on your chart and tells you what already happened. This is a systematic market structure analysis engine that does the heavy lifting of multi-timeframe analysis across your entire watchlist, so you don't have to spend hours flipping between pairs and timeframes trying to spot the same setups manually.
The indicator is built aroun

LSVR Pro – Market Structure and Liquidity Indicator LSVR Pro is a MetaTrader 5 market analysis indicator designed to help traders identify market structure, liquidity events, potential reversal areas and structured trade setups directly on the chart. Instead of relying on a single technical signal, LSVR Pro combines price structure and liquidity concepts to provide a clearer view of what the market is doing. Main Features Market Structure Analysis Automatically identifies Higher Highs (HH) Highe

Professional overview Volume Profile Trade Setups Scanner, designed to be both informative and highly persuasive for a trader looking for an edge.
---
The Volume Profile Trade Setups Scanner: Your Institutional Edge for Liquidity & Volatility
The Holy Grail of retail trading is not a strategy, but a framework for understanding where the "big money" is positioned.
The Volume Profile Trade Setups Scanner is not just another indicator; it is a proprietary, multi-strategy reconnaissance system

Forex Minor — 30-Engine Confluence Trading Desk for MT5
MT4 Version: https://www.mql5.com/en/market/product/194486
A full trading dashboard on one chart — 30 indicators, one verdict, one entry plan. Product Description Stop switching between fifteen indicators. Let one desk do the reading for you. Forex Minor is not another line on your chart — it's a complete trading workstation built directly on top of MetaTrader 5. It replaces your cluttered chart with a clean, professional HUD (heads-up

ATOM Architect Zone is an advanced Supply & Demand indicator built for traders who demand institutional-grade chart clarity without the visual clutter. Using sophisticated pivot logic and dynamic mitigation filtering, this tool identifies high-probability supply and demand boxes while automatically removing obsolete zones that have already been broken by price. Key Features: Dynamic Mitigation Engine: Automatically hides broken zones, keeping your charts clean and focused only on valid liquidity

CRASH & PAINX AI SPIKE DETECTOR 1.2 The Intelligent Spike-Detection System Built Specifically for Crash & PainX Markets Stop trading blindly. Start trading with an AI-powered detection system designed to identify high-probability spike opportunities before you enter the market. The CRASH & PAINX AI SPIKE DETECTOR 1.2 is a specialized trading indicator developed for Deriv Crash Indices and Weltrade PainX Assets . Unlike ordinary indicators that simply follow price movement, AI Spike Detector 1

GAINX AI SPIKE DETECTOR 1.2
The Intelligent Spike-Detection System Built Specifically for Boom & GainX Markets
Stop guessing when the next upward spike is coming. Start trading with a specialized AI-powered detection system designed to help you identify high-probability Boom and GainX spike opportunities.
The BOOM & GAINX AI SPIKE DETECTOR 1.2 is a specialized trading indicator developed for all Deriv Boom Indices and all Weltrade GainX Assets. It is built around the unique price behavior of th

TIF – Trend Integrity Filter
Trade With the Trend. Filter the Noise.
TIF (Trend Integrity Filter) is a professional trend-analysis indicator designed to help traders identify the dominant market direction and filter out lower-quality trades that go against the prevailing trend.
TIF can be used as a standalone trend filter or combined with your existing trading strategy, entry indicator, price action system or Expert Advisor.
KEY FEATURES
Trend Integrity Analysis
Helps identify the cur

High Time Candlestick Chart Visualize the current higher-timeframe candle directly on your lower-timeframe chart. This indicator projects the OHLC data of a selected higher timeframe (M15, H1, H4, D1, or W1) onto your current chart as a graphical candlestick, offset to the right of the live price area. It helps you keep the bigger-picture candle structure in view without switching timeframes. Features Graphical HTF candle : Body, upper wick, and lower wick drawn as chart objects, colored by bu

QuantEdge Suite — Smart Market Structure & Price Action Analysis QuantEdge Suite is a comprehensive MT5 indicator toolkit designed to help traders analyze market structure, liquidity levels, price-action patterns, and key trading zones from a single workspace. Instead of relying on multiple separate indicators, QuantEdge Suite brings several essential analysis tools together to give traders a cleaner and more structured view of the market. What QuantEdge Suite Includes SMC Structure Module Id

Smart Money Concepts — Market Structure, Order Blocks & Built-In Signal Tester What it does This indicator maps price action onto the chart using the "Smart Money Concepts" (SMC) framework — a way of describing market structure, liquidity, and imbalance that has become common terminology among price-action traders. It identifies and labels these elements automatically, on two structural levels at once (internal and swing), and keeps a running numerical record of every element in the Data Window

MTF Smart Indicators (MT5)
One chart. Every layer of the market. Every zone scored.
MTF Smart Indicators (MSI) is not another zone-drawing tool. It is a complete multi-timeframe trading workstation that finds institutional zones on four timeframes at once, grades each one on a 0–10 confluence score, and then verifies that score against what actually happened on your own symbol.
---
1. Why MSI is different
Most indicators draw. MSI decides.
- Multi-timeframe by design, not by duplication.

TITAN Market Analyzer V4 Advanced Multi-Layer Market Analysis for MetaTrader 5 TITAN Market Analyzer V4 is a professional analytical indicator for MetaTrader 5 designed to provide a structured view of market conditions by combining multiple analytical methodologies into one unified dashboard. The indicator does not execute trades . It is designed to help traders analyze the market, identify confluence, understand market structure, evaluate liquidity and volatility, and build a clear analytical t

MTF TREND MATRIX DASHBOARD FOR METATRADER 5
Multi-Timeframe Multi-Symbol Moving Average Ribbon, ADX Trend Strength & Momentum Matrix OVERVIEW & INSTITUTIONAL LOGIC:
Combines M5 through Daily moving average ribbons (10, 20, 50, 100, 200), RSI momentum, and ADX trend conviction into an interactive matrix featuring one-click timeframe switching pills. THE 10 CORE FUNCTIONALITIES: Automated institutional market structure and volatility calculation. High-performance, zero-lag calculation architectu

SR Power Channel — Support & Resistance Power Channel Indicator Overview SR Power Channel is a main-chart visual indicator built on price extremes and ATR. It locates the highest high (resistance) and the lowest low (support) within a configurable lookback window, extends those two levels to the right, and wraps them into ATR-based channel bands. The indicator also counts bullish and bearish bars inside the window and marks the moments when price breaks above or below the channel bands with dia

Индикатор, дающий сигналы на покупку только во время подтвержденных импульсов. Это позволяет большую часть времени находится в деньгах, а не в большой просадке по Биткоину. Благодаря этому, просадка падает до 25%, а прибыль вырастает в 4 раза. Подтверждено тестами на Трейдингвью, и советником собственной разработки. Это лучше простого удержания Биткоина.
Живой мониторинг

RSI Pro Ar Brain — classic RSI with a brain
A standard RSI gives the same signals on every timeframe and every asset — and that is exactly why it often fails. On volatile crypto it always “screams” overbought; on calm gold it “falls asleep” in the neutral zone.
RSI Pro Ar Brain rethinks the classic oscillator: the indicator automatically adjusts to the current timeframe and the real volatility of the instrument, filters out the noise and only gives signals where they actually make sense.
Key

Ambush Swing Structure doesn't wait for the market to announce itself — it reads RSI extremes to plot swing highs and lows, then layers on full market structure: Breaks of Structure, Changes of Character, and the exact moment a trend flips sides. Two indicators' worth of clarity in one clean overlay, with zero repainting nonsense. Drop it on any chart, keep the defaults, and let structure reveal itself in real time. Built by Ambush Pips for traders who'd rather stalk the move than chase it.
Learn how to purchase a trading robot from the MetaTrader Market, the store of application for the MetaTrader platform.
The MQL5.community Payment System supports transactions via PayPal, bank cards and popular payment systems. We strongly recommend that you test the trading robot before buying, for a better customer experience.

You are missing trading opportunities:
- Free trading apps
- Over 8,000 signals for copying
- Economic news for exploring financial markets
Registration
Log in
You agree to website policy and terms of use
If you do not have an account, please register