 All orders
 Rules
Rules
Watch how to order a trading robot
Read the Rules before you post an order or execute it
How to Order a Trading Robot in MQL5 and MQL4
See a sample Requirements Specification to order a robot
New orders in the category:
250 - 500 USD
30+ USD
30 - 50 USD
30 - 40 USD
30+ USD
Specification
I have mq4 indicator (attached its ex4 - RDI.ex4 - i will
share mq4 when we agree) - i want to :
1- convert this indicator RDI.ex4 from mq4 to thinkorswim TOS - i share only the ex4 here but mq4 available once we agree - It is about 130 lines code.
2- build a dashboard based on this new TOS indicator for multiple symbols and timeframes.
Dashboard can be shown in Watchlist table by adding 1 column for each timeframe.
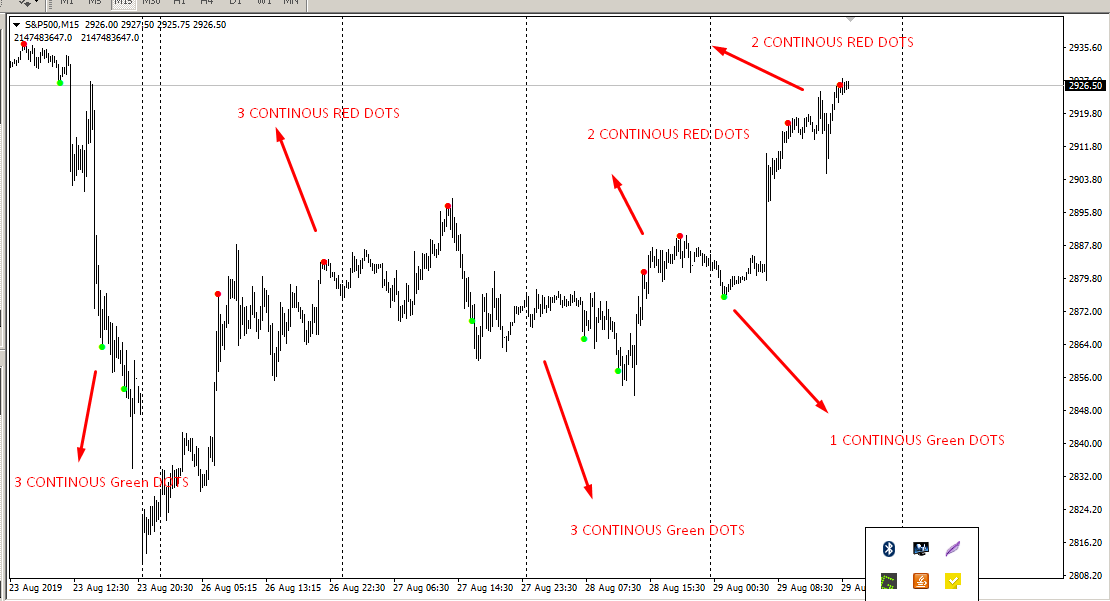
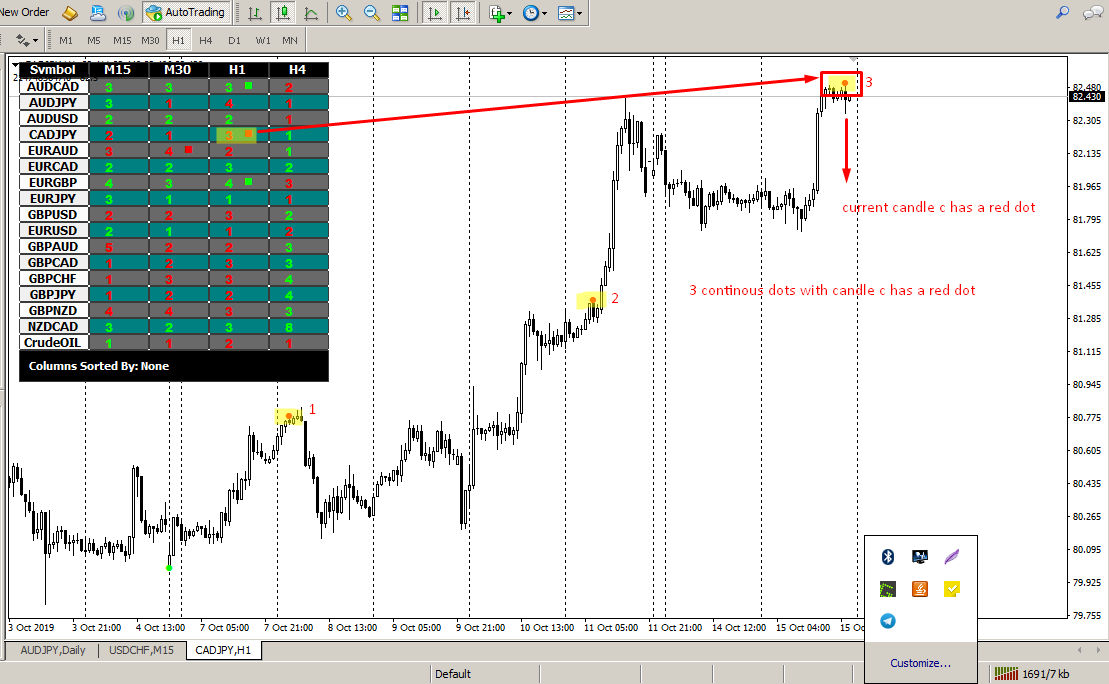
based on the indicator built from #1 which will shows dots (green/red) below/above candles.
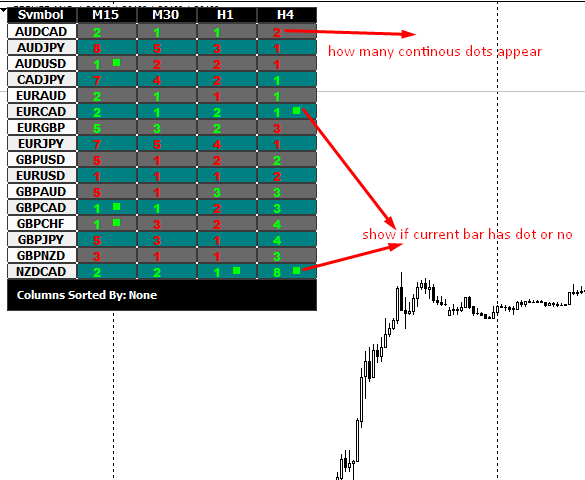
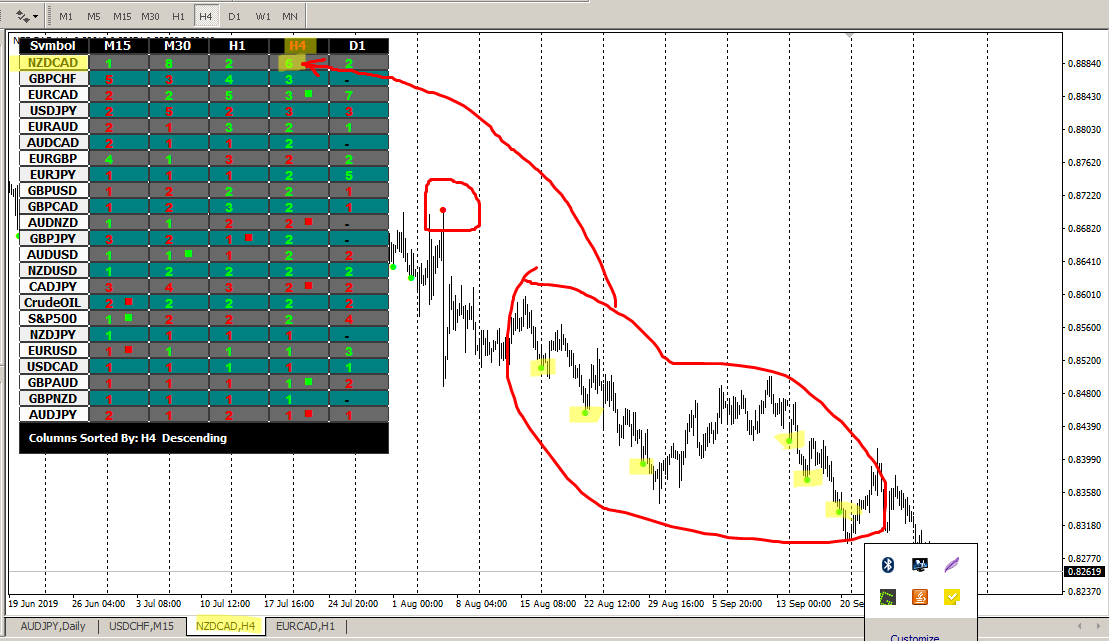
build a dashboard table which shows many timeframes/many symbols:
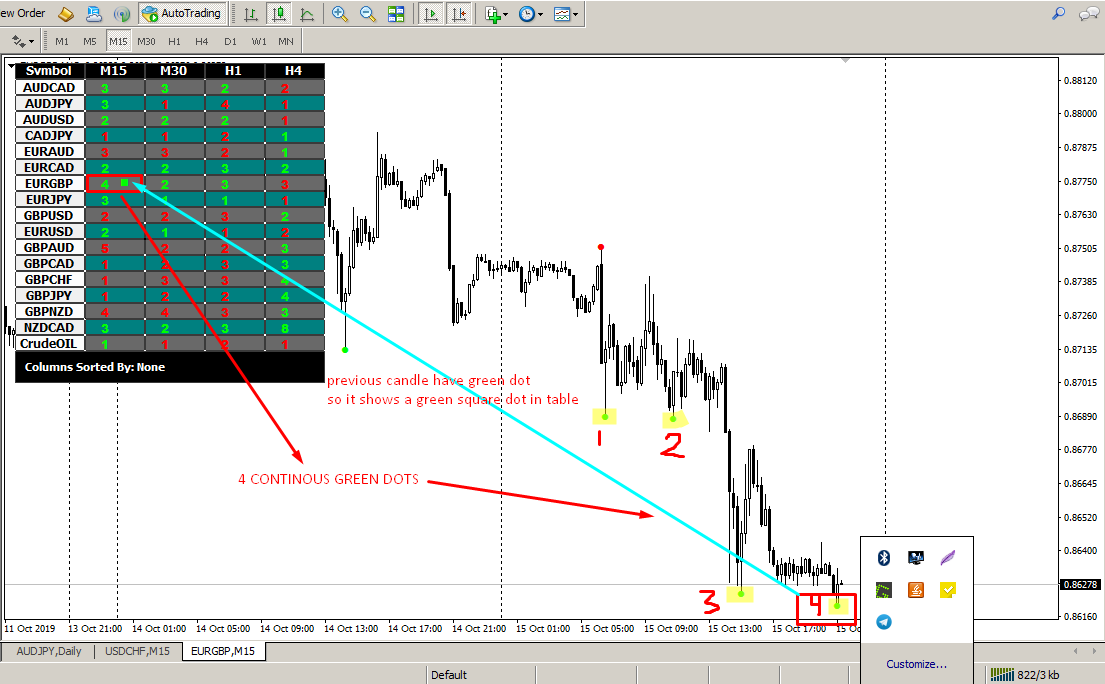
- color back the cell if candle (c-1) have dot (green/red).
- write the number of continuous dots (red/green) without interruption inside the cell : this # shows how many continuous dots appeared (continuous red dots or continuous green dots).
If we look at it in sequence as each new dot appears:
red dot - red count = 1
red dot - red count = 2
red dot - red count = 3
red dot - red count = 4
green dot - start new count - green count = 1
green dot - green count = 2
green dot - green count = 3
red dot - start new count - red count = 1
red dot - red count = 2
red dot - red count = 3
green dot - start new count - green count = 1
green dot - green count = 2
etc....
So : color the background of the cell with the corresponding color (red/green) if the candle (c-1) has a dot. and place a number that tells how many continuous dots it has Been in a row without interruption of other dot color.
Again - 1st column it shows if candle (c-1) appeared a green/red dot.
second column it shows green number / red number that reflects how many continuous green dots/red dots happened in a row without a new red dot/green dot come in to discontinue the sequence.
color the cell if the candle (c-1) happen to have a green/red dot and write the number of continuous dots that occurred in sequence without interruption of other dot color.
1- convert this indicator RDI.ex4 from mq4 to thinkorswim TOS - i share only the ex4 here but mq4 available once we agree - It is about 130 lines code.
2- build a dashboard based on this new TOS indicator for multiple symbols and timeframes.
Dashboard can be shown in Watchlist table by adding 1 column for each timeframe.
based on the indicator built from #1 which will shows dots (green/red) below/above candles.
build a dashboard table which shows many timeframes/many symbols:
- color back the cell if candle (c-1) have dot (green/red).
- write the number of continuous dots (red/green) without interruption inside the cell : this # shows how many continuous dots appeared (continuous red dots or continuous green dots).
If we look at it in sequence as each new dot appears:
red dot - red count = 1
red dot - red count = 2
red dot - red count = 3
red dot - red count = 4
green dot - start new count - green count = 1
green dot - green count = 2
green dot - green count = 3
red dot - start new count - red count = 1
red dot - red count = 2
red dot - red count = 3
green dot - start new count - green count = 1
green dot - green count = 2
etc....
So : color the background of the cell with the corresponding color (red/green) if the candle (c-1) has a dot. and place a number that tells how many continuous dots it has Been in a row without interruption of other dot color.
Again - 1st column it shows if candle (c-1) appeared a green/red dot.
second column it shows green number / red number that reflects how many continuous green dots/red dots happened in a row without a new red dot/green dot come in to discontinue the sequence.
color the cell if the candle (c-1) happen to have a green/red dot and write the number of continuous dots that occurred in sequence without interruption of other dot color.
Similar orders
MT4 expert advisor
500+ USD
I have three indicators that operate independently. I want to combine them into one indicator with custom expert programming that automatically enters trades when a signal is generated by one of the indicators. I will pay for this service Thanks you
Goldn zon
30+ USD
Hello, I am looking for a developer. I have a robust strategy based on Fibonacci, which I call "Goldn Zon." I tested it myself throughout the month of September, and now I would like to have a bot implement it so that it can trade continuously
Scalping bort
30+ USD
GOLD SCALPING BOT STRATEGY Symbol: XAUUSD (Gold vs USD) Broker: Exness Account: Standard Starting Balance: $20 1. TIMEFRAME - Trend analysis: M15. - Entry timeframe: M5. - Trade only when the market has a clear direction. 2. INDICATORS - EMA 50 - EMA 200 - RSI 14 - Support and Resistance 3. BUY RULES The bot must open a BUY trade only when all these conditions are met: 1. EMA 50 is above EMA 200 on M15. 2. Price is
Request for an Existing Automated Trading System (Expert Advisor) I am looking to acquire an existing, fully functional Expert Advisor (EA) that trades Forex CFDs, with the option of trading other CFDs if the strategy supports them safely. Performance objectives Target average net monthly return: 1.5%. A consistent 1.0% monthly return may be considered if the system demonstrates strong risk control and credible
Project information
Budget
30+ USD
Deadline
to 5 day(s)