スピーディに自動売買ロボットを注文する方法を見る
注文を投稿するまたは受注する前にルールをご覧ください。
MQL5およびMQL4で自動売買ロボットを注文する方法
ロボットを注文するにはサンプル要件仕様をご覧ください
カテゴリでの新規注文:
50 - 250 USD
30 - 200 USD
30 - 500 USD
150 - 200 USD
指定
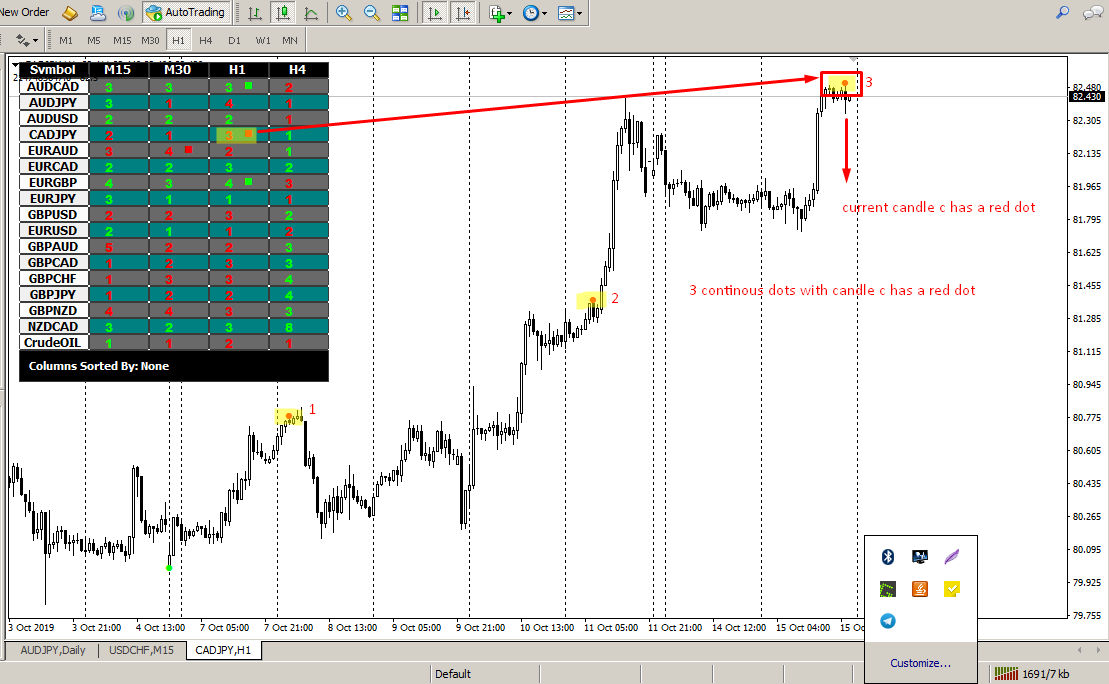
I have mq4 indicator (attached its ex4 - RDI.ex4 - i will
share mq4 when we agree) - i want to :
1- convert this indicator RDI.ex4 from mq4 to thinkorswim TOS - i share only the ex4 here but mq4 available once we agree - It is about 130 lines code.
2- build a dashboard based on this new TOS indicator for multiple symbols and timeframes.
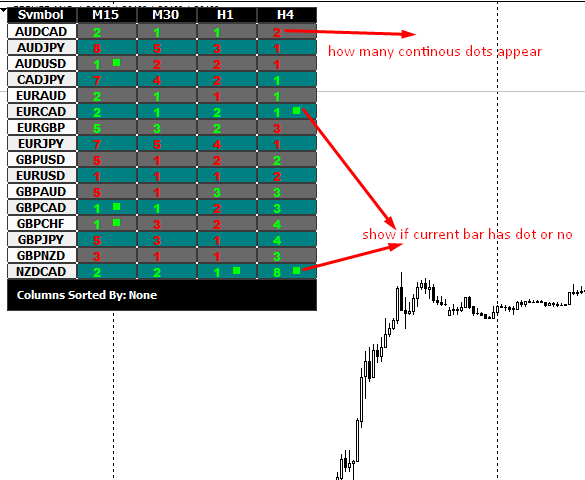
Dashboard can be shown in Watchlist table by adding 1 column for each timeframe.
based on the indicator built from #1 which will shows dots (green/red) below/above candles.
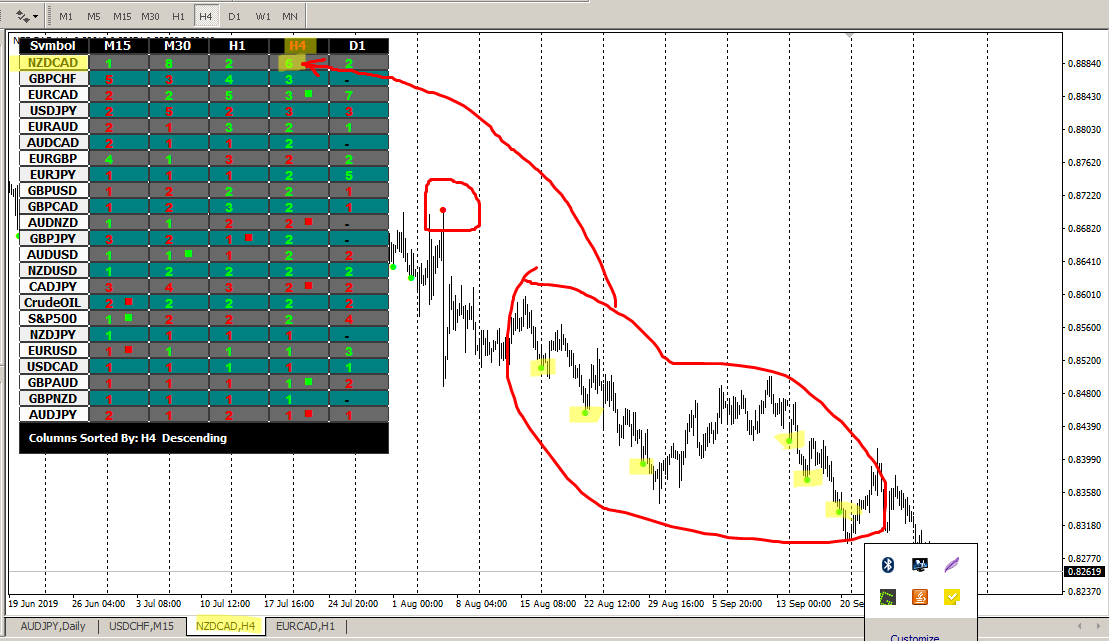
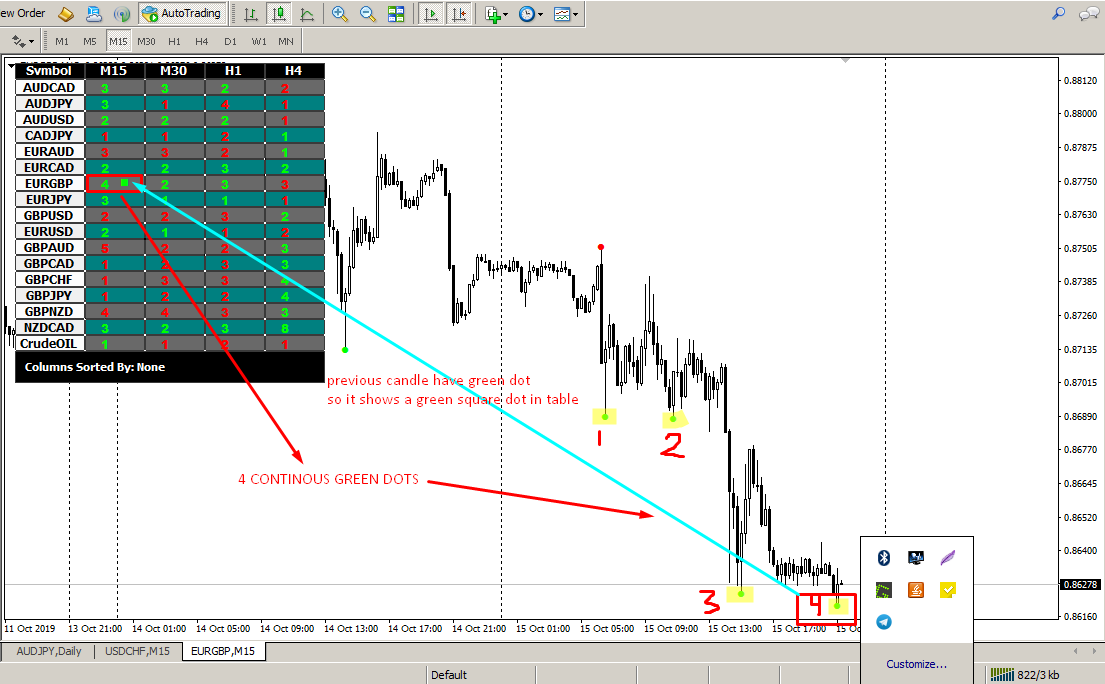
build a dashboard table which shows many timeframes/many symbols:
- color back the cell if candle (c-1) have dot (green/red).
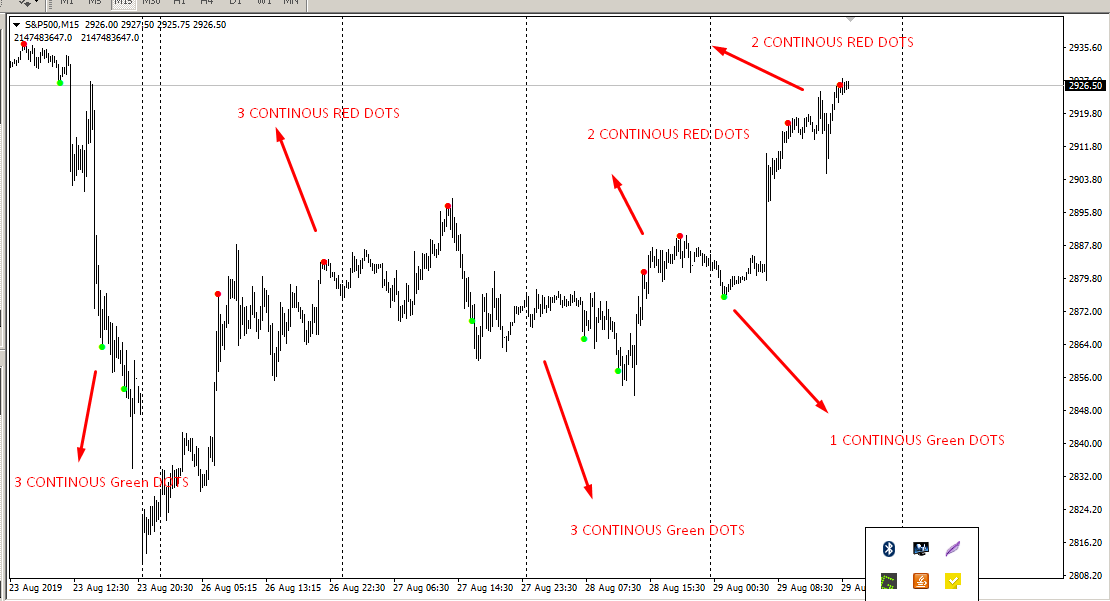
- write the number of continuous dots (red/green) without interruption inside the cell : this # shows how many continuous dots appeared (continuous red dots or continuous green dots).
If we look at it in sequence as each new dot appears:
red dot - red count = 1
red dot - red count = 2
red dot - red count = 3
red dot - red count = 4
green dot - start new count - green count = 1
green dot - green count = 2
green dot - green count = 3
red dot - start new count - red count = 1
red dot - red count = 2
red dot - red count = 3
green dot - start new count - green count = 1
green dot - green count = 2
etc....
So : color the background of the cell with the corresponding color (red/green) if the candle (c-1) has a dot. and place a number that tells how many continuous dots it has Been in a row without interruption of other dot color.
Again - 1st column it shows if candle (c-1) appeared a green/red dot.
second column it shows green number / red number that reflects how many continuous green dots/red dots happened in a row without a new red dot/green dot come in to discontinue the sequence.
color the cell if the candle (c-1) happen to have a green/red dot and write the number of continuous dots that occurred in sequence without interruption of other dot color.
1- convert this indicator RDI.ex4 from mq4 to thinkorswim TOS - i share only the ex4 here but mq4 available once we agree - It is about 130 lines code.
2- build a dashboard based on this new TOS indicator for multiple symbols and timeframes.
Dashboard can be shown in Watchlist table by adding 1 column for each timeframe.
based on the indicator built from #1 which will shows dots (green/red) below/above candles.
build a dashboard table which shows many timeframes/many symbols:
- color back the cell if candle (c-1) have dot (green/red).
- write the number of continuous dots (red/green) without interruption inside the cell : this # shows how many continuous dots appeared (continuous red dots or continuous green dots).
If we look at it in sequence as each new dot appears:
red dot - red count = 1
red dot - red count = 2
red dot - red count = 3
red dot - red count = 4
green dot - start new count - green count = 1
green dot - green count = 2
green dot - green count = 3
red dot - start new count - red count = 1
red dot - red count = 2
red dot - red count = 3
green dot - start new count - green count = 1
green dot - green count = 2
etc....
So : color the background of the cell with the corresponding color (red/green) if the candle (c-1) has a dot. and place a number that tells how many continuous dots it has Been in a row without interruption of other dot color.
Again - 1st column it shows if candle (c-1) appeared a green/red dot.
second column it shows green number / red number that reflects how many continuous green dots/red dots happened in a row without a new red dot/green dot come in to discontinue the sequence.
color the cell if the candle (c-1) happen to have a green/red dot and write the number of continuous dots that occurred in sequence without interruption of other dot color.
類似した注文
EA Crafter
500+ USD
Act as a professional Quantitative Developer and Risk Manager. I want to build a systematic trading strategy rulebook that prioritizes capital preservation and statistical edge over raw performance. Please generate a structured trading strategy using the following framework: 1. ASSET CLASS & TIMEFRAME: - Asset: [e.g., Apple (AAPL), Bitcoin (BTC), or EUR/USD] - Timeframe: [e.g., 5-minute, 1-hour, Daily] 2. CORE
JOB TITLE: XAUUSD ONLY MQL5 Strategy Developer Needed To Improve Existing MT5 EA Winrate JOB DESCRIPTION: I already have a working MetaTrader 5 Expert Advisor with a fixed set file and existing trading logic. The strategy is based on Volume Profile / Delta bias, ATR-based TP/SL, ATR deviation filtering, ATR trade spacing, break-even after TP1, and TP lock management. I am looking for an experienced MQL5 / trading
Build NINJATRADER 8
30+ USD
Can you Build a custom NinjaTrader 8 ChartStyle or BarsType called Optimized Footprint Bars. This project is urgent and i need someone that's wiiling to do his project with me kinldy bid for this. Thanks
Institutional‑Grade Multi‑Currency MT5 EA
1000 - 1300 USD
Hello, I am reopening this project with a fully updated and clarified specification. I am looking for a high‑level MQL5 developer who can deliver a clean, stable, and professional Phase 1 version of my: Institutional‑Grade Multi‑Currency MT5 EA (A2SR + SMC + Smart Recovery + Smart Grid + Liquidity + Volatility + Safety Filters) This EA is not a simple indicator conversion or a basic strategy. It is a structured
Hello, I'm interested in a quote to convert my manual trading strategy into an automated strategy for NinjaTrader. Please note, I would like the quote based on the work and not my available budget; therefore, I entered $5 for the budget. Additionally, I would appreciate knowing how long it would take to build/test. I would prefer to have it sooner rather than later but selected 7 days not knowing how long it takes to
Pine Script Integration Request (Experienced Coders Only) I am looking for a highly experienced Pine Script developer to integrate a Demand & Supply Zone module into my existing indicator. Requirements Keep my current indicator (Rudy) exactly as it is. Do NOT modify, remove, or alter any existing logic, calculations, signals, alerts, or visual elements. Add only the Demand & Supply Zone boxes from a second Pine
Professional AI Automation Trading Bot for Forex & Crypto
500 - 1500 USD
Title Professional AI Automation Trading Bot for Forex & Crypto Solution Language Python (preferred) or MQL5 depending on integration requirements. Categories Expert Advisor (EA) for MetaTrader 5 Automated trading strategies AI/ML-based signal generation Risk management automation Required Skills Strong knowledge of MQL5/Python Experience with MetaTrader API integration Machine learning model deployment
プロジェクト情報
予算
30+ USD
締め切り
最高 5 日