Secondary axis
Hello,
I would like to know if it is possible to have different axes for different drawing buffers in an indicator. For example if I want to build in volume or an oscillator on an indicator that plots candlesticks, but this makes the data unreadable for the human eye, because the volume stretches out the scale.
Is there any way to set up a secondary axis or make the indicator create additional subwindows?
Thanks
I'm not sure that I understand what you trying to do, so maybe you can give more example, but this : "... because the volume stretches out the scale", really ?
Example and try this : attach MACD, then drag and drop RSI and Volume (NOT attach) on to that MACD. RSI has fixed chart but not for MACD and Volume. MACD and RSI has axis but not Volume. Now if do it right, you will have MACD and RSI and Volume on the same single sub-chart window.
I will show you what I mean, I made a Renko indicator and I want to add in a plot that shows the time it took for a brick to build. I haven't written the code for that yet, so I will set it at a fixed level (5) for now to illustrate what happens.
Chart without: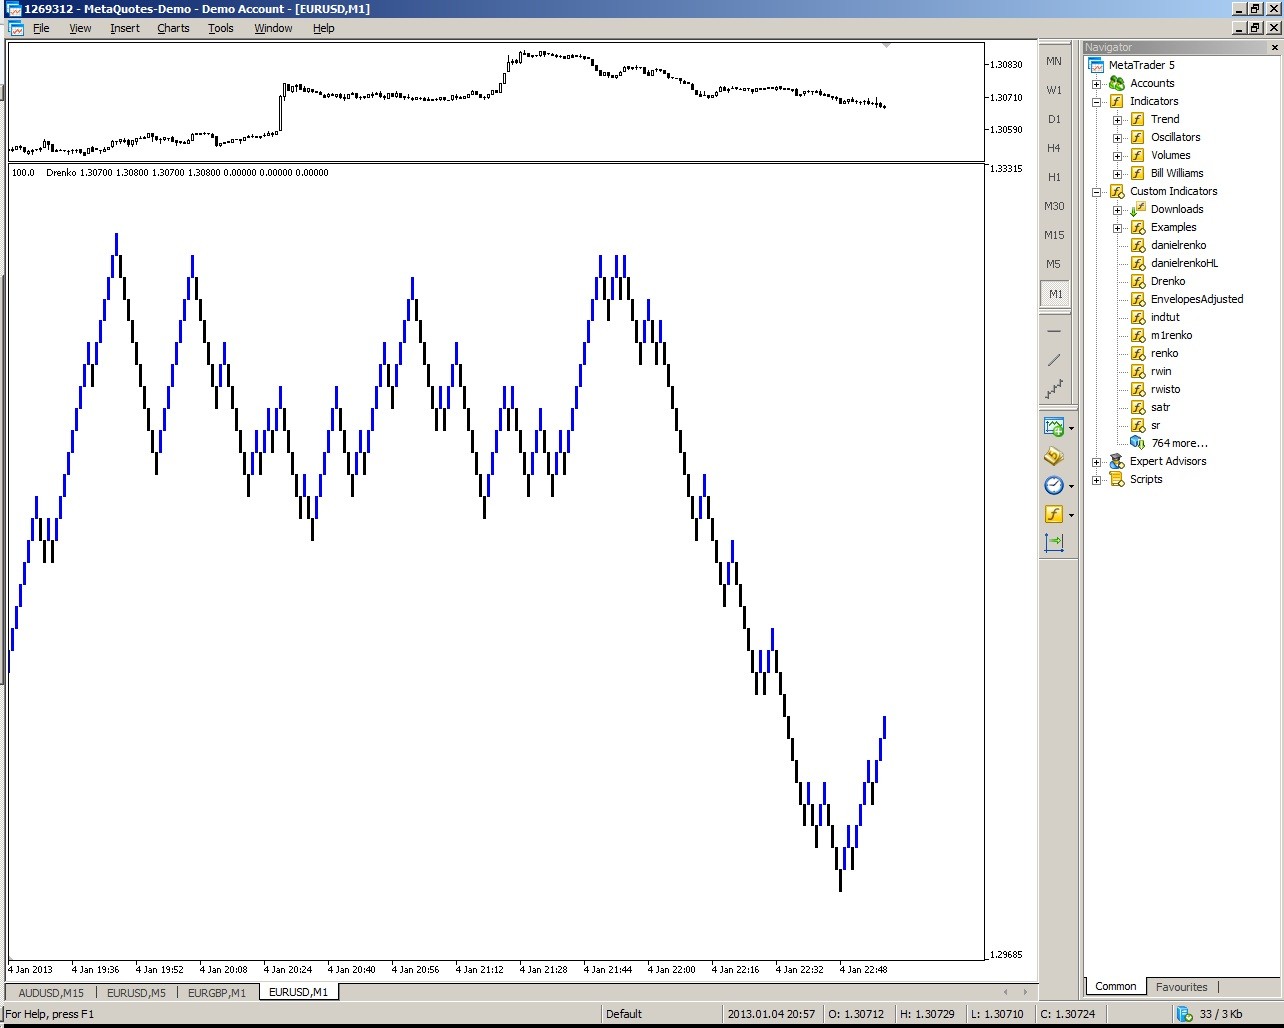
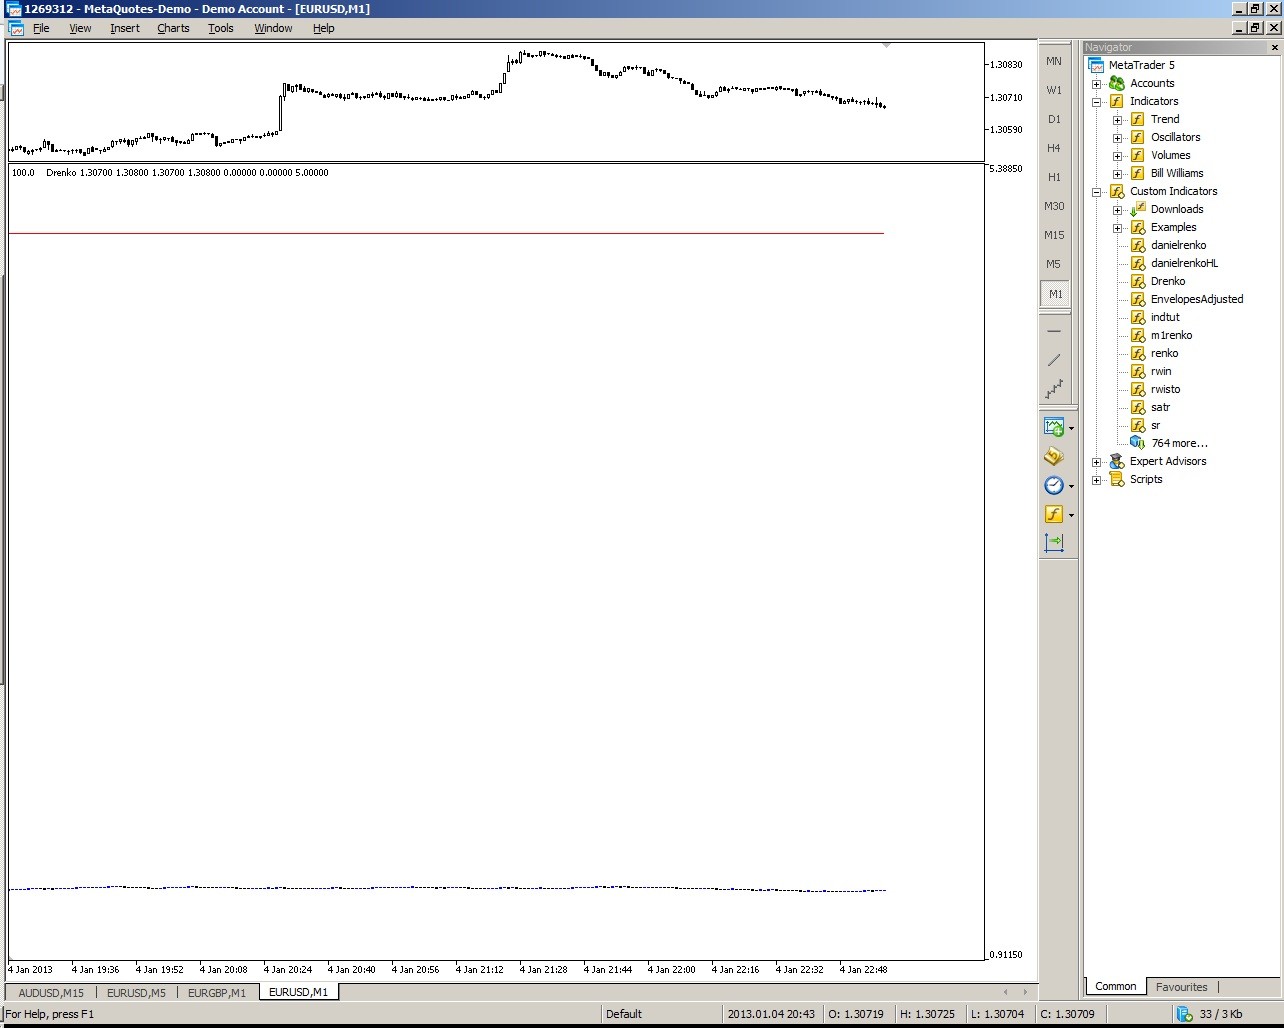
Chart with additional indicator:
I will show you what I mean, I made a Renko indicator and I want to add in a plot that shows the time it took for a brick to build. I haven't written the code for that yet, so I will set it at a fixed level (5) for now to illustrate what happens.
Chart without:
Chart with additional indicator:
Ah yes, thank you for clarify what you mean. The value difference between that 2 indicator is too big, especially on EURUSD with fractional pips, one is change in Point (0.00001) and the other is in integer of - at least the changing value is : 1.
There are two ways to do this :
1. Draw 2 indicators to solve your problem :(. The renko should pass the volume data to a file using File Functions's FileWriteArray and the volume indicator should read the data using FileReadArray. Make sure to use flag FILE_SHARE_READ for FileOpen when open the file for writing/reading the data.
2. Draw that volume as histogram using Object Functions :(. So the Object types should be OBJ_RECTANGLE, and should be drawn from the bottom of the visible chart window using ChartGetDouble's CHART_PRICE_MIN of Chart Operations, and you have to draw that rectangle object with ratio between value of volume and height of chart in pips.
That's what I can think of right now, and unfortunately none of them is easy.
The file functions are working well, thanks for that again.
I have encountered a different problem which I narrowed down to class constructors being called twice in the strategy tester. A simplified version of the problem:
#property indicator_separate_window
// global level
class ctest
{
public:
ctest(int x);
};

ctest one(1);
ctest two(2);

//----------------------
int OnInit()
  {return(0); }

int OnCalculate(const int rates_total,
                const int prev_calculated,
                const int begin,
                const double &price[])
  {return(rates_total);  }
//----------------------

ctest::ctest(int x)
{
Print(x);
}
In the regular terminal this prints out "1 2" when being initialized, but in the indicator strategy tester the same code prints out "1 2 1 2", this feature is causing me some problems. Am I missing something obvious here?
- Free trading apps
- Over 8,000 signals for copying
- Economic news for exploring financial markets
You agree to website policy and terms of use
Hello,
I would like to know if it is possible to have different axes for different drawing buffers in an indicator. For example if I want to build in volume or an oscillator on an indicator that plots candlesticks, but this makes the data unreadable for the human eye, because the volume stretches out the scale.
Is there any way to set up a secondary axis or make the indicator create additional subwindows?
Thanks