Forecast for Q4'16 - levels for S&P 500
If we analyse NASDAQ in 'american way' using 100 SMA/200 SMA (Moving Averages) so we can get the following:
Dailty chart (till October this year). The price is located on the primary bullish area for the ranging within 4891.60 resistance level and 4782.10 support.
- If the price breaks 4891.60 resistance so the bullish trrend will be continuing.
- If the price breaks 4782.10 support to below so the local downtrend as the secondary correction within the primary bullish trend will be started.
- If the price breaks 4648.60 support level so the price will be started on the ranging condition near the bearish reversal area.
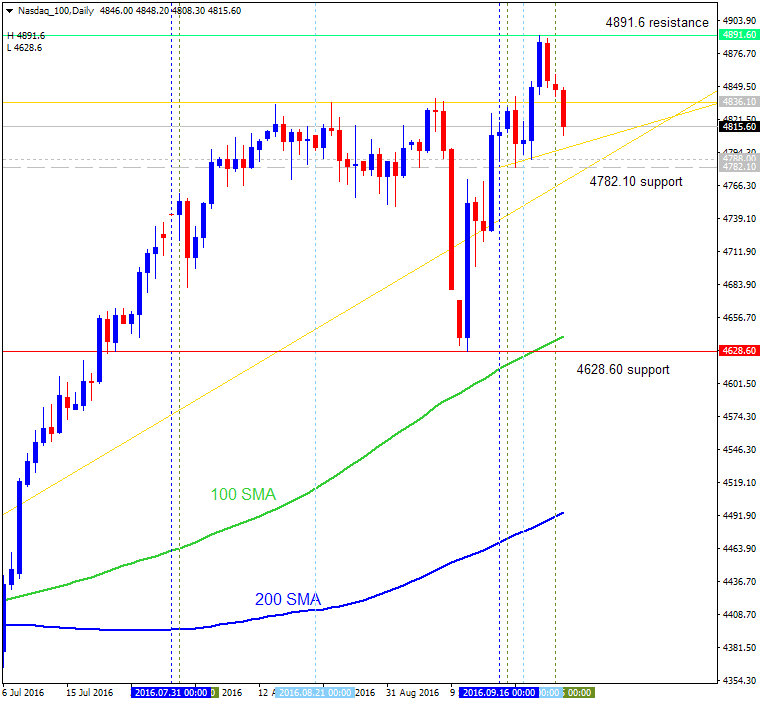
I think, the most likely scenario for the price movement till October this year is the following: bullish ranging within 4891/4648 levels.
Weekly chart (the situation till the end of this year). This is very similar situation with the daily chart, and we are having almost same levels as well:
- If the price breaks 4891.60 resistance so the bullish trrend will be continuing.
- If the price breaks 4648.60 support to below so the local downtrend as the secondary correction within the primary bullish trend will be started.
- If the price breaks 3862.10 support level so the reversal of the price movement from the ranging bullish to the primary bearish market condition will be started.
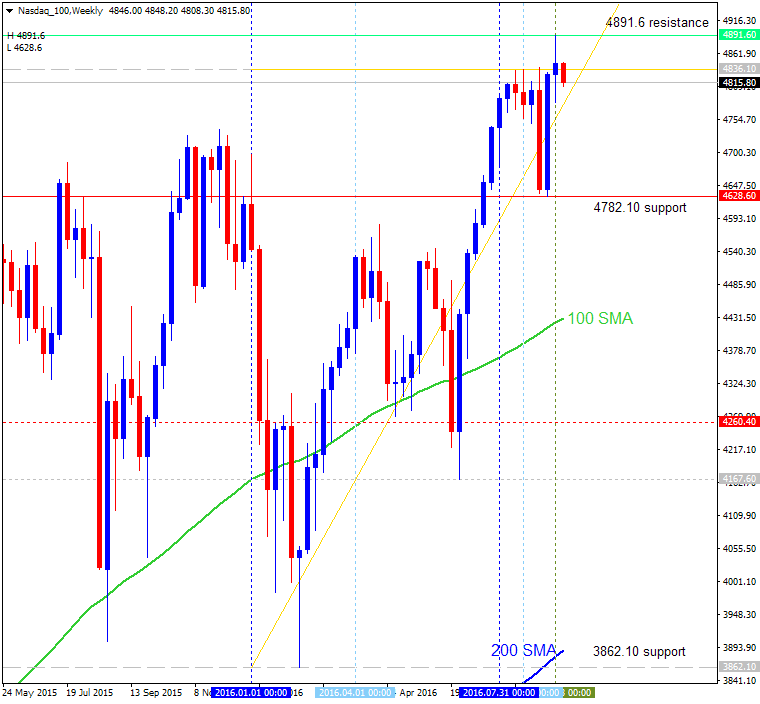
I think, the most likely scenario for the price movement till the end of this year is the following: bullish ranging within 4891/4648 levels.
So, this is not good, not bad, just same - for short-term situation for the month and for the rest of the year (till the end of 2016 for example).
As we look at the monthly chart (the situation from now till the end of 2017) so the price is on bullish with 4891.60 resistance level to be tested to above for the bullish trend to be continuing or for the long-term ranging to be started.
Thus, 4891.60 is the key level (same with 4782.10 and 4648.60 for example).
Forum on trading, automated trading systems and testing trading strategies
Sergey Golubev, 2016.10.01 10:41
Week Ahead On Wall Street: Jobs Report, Google Product Unveil (based on the Forbes article)
Monday
- "Ford, General Motors and other U.S. automakers report their September sales figures. While sales have softened this year, the seasonally adjusted annual sales rate is still expected to top 17.6 million, according to analysts surveyed by Bloomberg. Last year, Americans bought a record-breaking 17.5 million vehicles."
Tuesday
- "Google will show off its new products."
- "U.S. Federal Reserve Bank of Richmond President Jeffrey Lacker will speak at a conference in West Virginia."
- "Darden Restaurants and Micron, which has struggled mightily due to falling demand for its memory chips, are out with earnings."
- "Vice presidential nominees Mike Pence and Tim Kaine will take the debate stage for their turn in the limelight. Presidential nominees Donald Trump and Hillary Clinton went head to head last week."
Wednesday
- "The U.S. Supreme Court, which begins its term this week, will hear arguments on an insider trading case. The decision could alter the way in which regulators define insider trading."
- "U.K. Prime Minister Theresa May will give the keynote speech at the Conservative party conference and will likely touch on Brexit."
- "Monsanto, which was just bought by Bayer for $66 billion, reports earnings in the morning. It will be followed in the afternoon by Yum, the parent company of KFC, Pizza Hut and Taco Bell."
- "The Fed’s Charles Evans and Jeffrey Lacker will speak at separate events."
Thursday
- "Some of Wall Street’s biggest names, including Jaime Dimon, James Gorman, Michael Corbat and Mohamed El-Erian, will speak at a meeting held by the Institute of International Finance that continues through Saturday.
- "The European Central Bank will release the minutes from its policy meeting in September, at which President Mario Draghi said there was no change to their monetary policy.
Friday
- "It’s time to take another pulse of the labor market. U.S. employers are expected to have added 175,000 jobs in September and the unemployment rate should be steady at 4.9%."
- "The IMF and World Bank convene their 2016 annual meeting in Washington, D.C. Among the scheduled speakers are former Treasury Secretary Tim Geithner and Bank of England Governor Mark Carney. On Sunday, IMF Managing Director Christine Lagarde will have a one-on-one conversation with financial journalist Michael Lewis, author of “The Big Short” and “Boomerang,” which will be live streamed here at 10 am ET."
Forum on trading, automated trading systems and testing trading strategies
Sergey Golubev, 2016.10.10 08:10
S&P 500 Weekly Update: Earnings Season Is Upon Us, A Positive Surprise May Be In The Offing (based on the article)
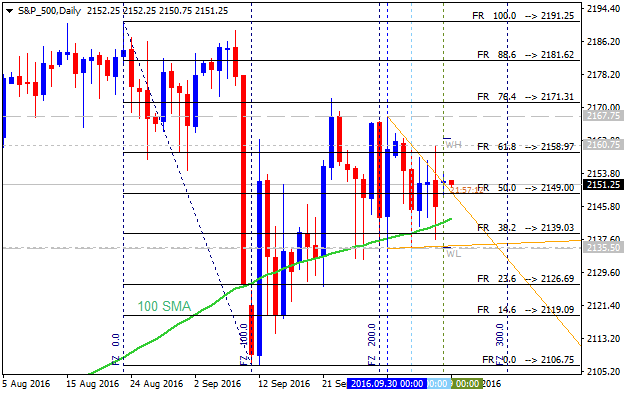
Daily price is on ranging above 200 SMA and near above 100 SMA for the ranging bullissh market condition waiting for the direction of the bullish trend to be resumed or for the bearish reversal to be started.
- "An investor has to be reactionary waiting for the market to give them clues, then reacting appropriately. I take my leads from price action, momentum, sentiment, and other indicators. All designed for me to decipher what the market is telling me. Never drifting too far from the one key that serves as the foundation to my current strategy. That is staying focused on the major trend that is in place, and that remains without question, in favor of the bulls."
- "Short term support is at S&P 2142, then the 2131 pivot, with resistance at the 2177 pivot and S&P 2194. Note that this week's low was 2144 and it held that level twice."
- "The S&P 500 earnings yield is nearly twice the yield on the 10 year treasury, which is among the highest readings in the post WWII era. Additionally, the dividend yield of S&P 500 is 50 basis points more than the 10 year US treasury and more than 300 stocks in S&P 500 yield more than 10 year US Treasury."
If the price breaks 2191 resistaance level to above on daily close bar so the primary bullish trend will be resumed.
If the daily price breaks 2106 support level to below on close bar so the bearish reversal will be started.
If not so the price will be on bullish ranging within the levels.
Forum on trading, automated trading systems and testing trading strategies
Sergey Golubev, 2016.10.24 09:13
Quick Technical Overview - S&P 500: Recovery Has Been The Strongest In History (based on the article)
Daily price is on ranging market condition located near and below Senkou Span line which is the virtual border between the primary bearish and the primary bullish trend on the chart. Symmetric triangle pattern was formed by the price to be crossed for the direction of the trend, and Absolute Strength indicator is estimating the ranging condition to be continuing in the near future.
Analyst Doug Short is comparring the next recovery with the past ones:
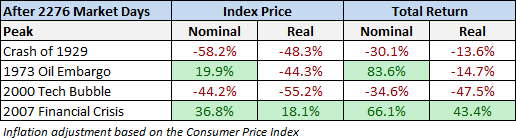
- The Crash of 1929, which eventually ushered in the Great Depression,
- The Oil Embargo of 1973, which was followed by a vicious bout of stagflation,
- The 2000 Tech Bubble bust and,
- The Financial Crisis following the record high in October 2007.
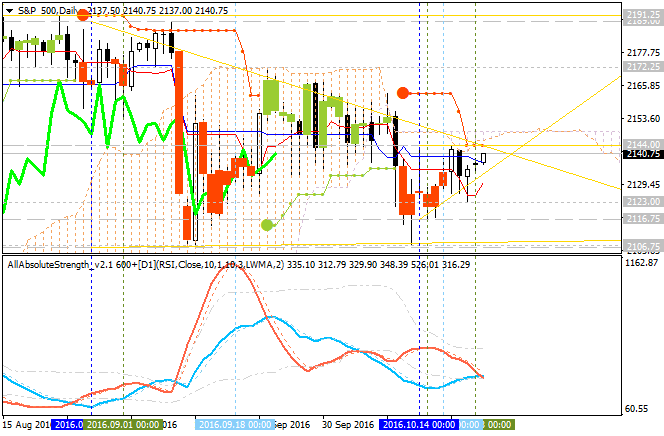
If W1 price will break 2,144 resistance level so the reversal to the primary bullish condition will be started.
If not so the price will be ranging within the levels.
Forum on trading, automated trading systems and testing trading strategies
Sergey Golubev, 2016.10.27 21:52
S&P 500 Intra-Day Technicals: H1 bearish reversal (adapted from the article)
H1 price broke 100 SMA/200 SMA levels to be reversed to the primary bearish market condition with 2,126 support level to be broken for the bearish trend to be continuing with 2,124/2,123 levels to re-enter.
- "The most critical level to watch as resistance comes at the 2146/50 area, where several inflection points of support and resistance can be found. To a less degree in this vicinity we have a trend-line running down off the 10/10 swing high. A break above brings the 10/24 swing high at 2155 into play, and on aggressive trade higher the trend-line extending lower off the 9/7 swing high. Several inflection points spanning over a fairly lengthy period make this an important trend-line to watch. To a lesser degree of importance, running near this t-line is the upper parallel off the 10/14 swing high. In the unlikely event we trade above the before mentioned resistance levels in the very near-term we will look to 2070 as the next stopping point."
- "On the downside, we first have support by way of a trend-line running higher off the important 10/13 daily low, then the lower parallel extending back to the 10/17 pivot. Horizontal support quickly comes into play around 2130, then 2124, and finally the important 2115 level."
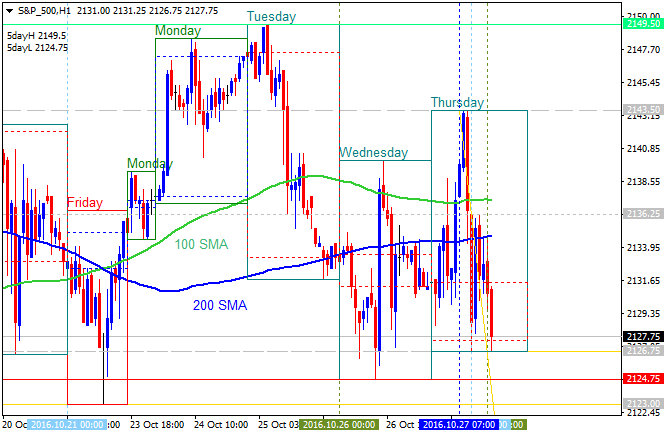
The most likely scenario for H1 price movement is the following: the price will cross 2,126 level to below with 2,124/2,123 next level to be broken for the bearish trend to be continuing.
Forum on trading, automated trading systems and testing trading strategies
Sergey Golubev, 2016.11.03 15:48
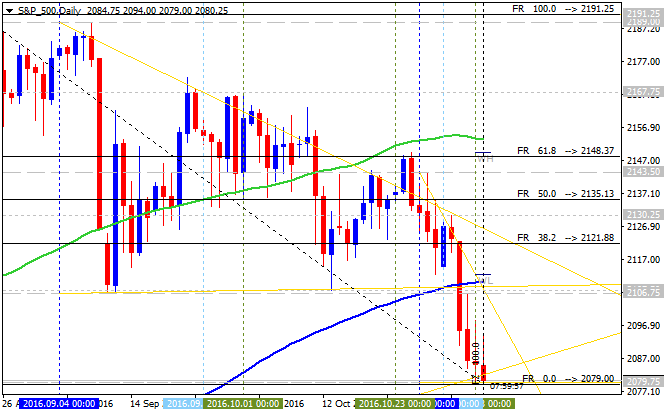
Quick Technical Overview - S&P 500: daily bearish reversal with 2,084 support (adapted from the article)
D1 price broke 200-day SMA to be reversed to the primary bearish market condition. The price is testing 2,084 support level to below for the bearish trend to be continuing.
- "The S&P 500 hasn’t had a positive day since last Monday, which isn’t to say the market should bounce just because it’s been down numerous consecutive days, but it certainly means, statistically, we are very likely close to at least one day up. With the election on Tuesday, and lots of uncertainty surrounding it, it is reasonable to conclude whatever bounce we get won’t be uber-powerful."
- "There are a few lines of influence intersecting in the vicinity of yesterday’s low at 2094 down to about 2085 – June, August, and October parallels (see chart). Below there the widely-watched 200-day lies at 2081. So, even though consecutive down days, in and of itself, doesn't qualify as an oversold indicator, when we have a confluence of technical events close at hand it increases the odds we will see support act as a springboard."
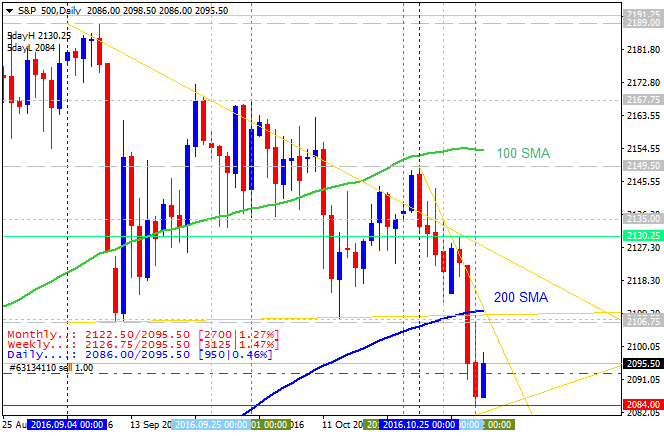
- If the price breaks 2,108
resistance level on close daily bar to above so the reversal of the price movement from the primary bearish to the ranging bullish market condition will be started.
- If daily price breaks 2,084
support level on close bar to below so the bearish trend will be continuing.
- If not so the price will be on ranging within the levels.
| Resistance | Support |
|---|---|
| 2,108 | 2,084 |
| 2,149 | N/A |
Trend:
Forum on trading, automated trading systems and testing trading strategies
Sergey Golubev, 2016.11.06 08:21
Week Ahead On Wall Street: Markets Brace For Election Results (based on Forbes article)
Monday
"British lawmakers will debate the implications of Brexit, after the High Court said that Parliament must give its approval before the country can move forward with its split from the European Union."
Tuesday
"It’s election day. Billionaire Elon Musk has begun campaigning for the merger of SolarCity and Tesla and last week promised that the tie-up would yield big financial benefits for Tesla investors."
Wednesday
"Goldman Sachs is expected to announce which of its top employees have achieved partner status. It does this every two years and in 2014 named 78 people to the position. The partnership ranks are tough to break into and represent fewer than 2% of the firm’s workers."
Thursday
"Starbucks CEO Howard Schultz, activist investor Bill Ackman, Goldman Sachs CEO Llyod Blankfein and others will speak at The New York Times’ Dealbook conference."
Friday
"Bond markets are closed for Veteran’s Day. The stock market will keep its normal hours."
- Free trading apps
- Over 8,000 signals for copying
- Economic news for exploring financial markets
You agree to website policy and terms of use
S&P 500 October-December 2016 Forecast: bullish ranging within s/r channel
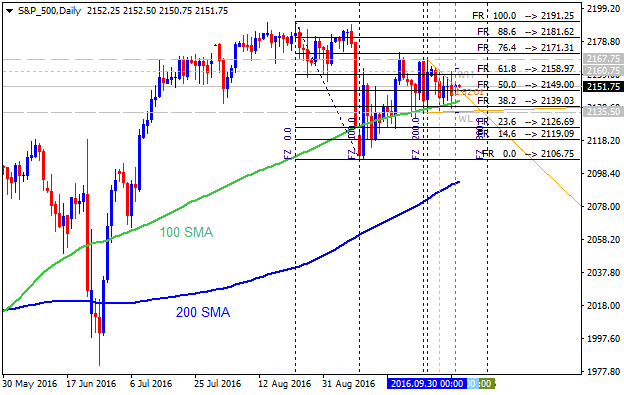
W1 price is on bullish ranging condition located above Ichimoku cloud for the ranging within 2191.25 resistance level for the bullish trend to be resumed and 2106.75 support level for the correction to be started. Bearish reversal level for this timeframe is 1951.31 support level, and if the price breaks this level to below so the long-term bearish reversal will be started.
Chinkou Span line is located above the price indicating the ranging bullish condition, Absolute Strength indicator is estimating the trend as a ranging in the future, and Tenkan-sen line/Kijun-sen line combination of Ichimoku indicator is evaluating the future trend as a primary bullish for example.
Trend:
W1 - ranging bullish