Forecast for Q2'16 - levels for DAX Index
By the way, the long-term situation for DAX Index is the following: secondary ranging within the bullish market condition -
- secondary ranging: the price is located within 100 SMA/200 SMA ranging area, and
- with primary bullish: above 200 SMA.
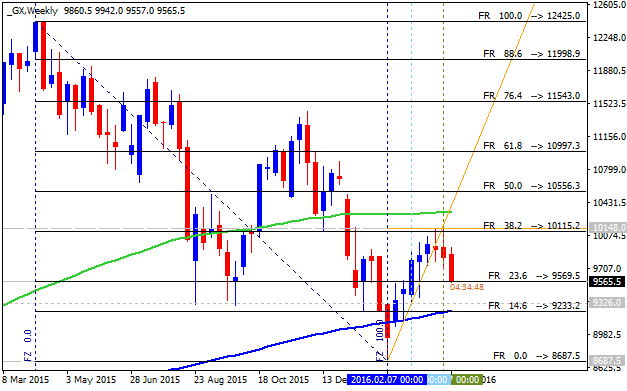
And the key bearish reversal level is 9,233. It means - if weekly close price breaks this level to below so we may see the global long-term bearish situation for DAX Index.
DAX Index Pivot Points Analysis - bearish ranging within Central Yearly Pivot and the First Support Pivot level
W1 price is located to be below yearly Central Pivot at 10,807 and above S1 Pivot at 9,190:
- The price is on bearish market condition for the ranging within Central Yearly Pivot and the First Support Pivot level;
- The
price is breaking trendline together symmetric triangle pattern to below for S1 Pivot at 9,190 as the nearest bearish target;
- If weekly price will break S1 Pivot at 9,190
so the primary bearish market condition will be continuing, otherwise the price will
be continuing to be ranging within Central Yearly Pivot and the First Support Pivot level.
| Instrument | S1 Pivot | Yearly PP | R1 Pivot |
|---|---|---|---|
| DAX Index |
9,190 | 10,807 |
12,317 |
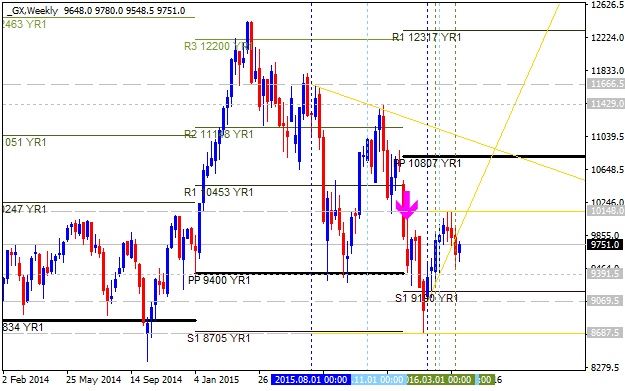
Trend:
- W1 - ranging bearish
Forecast for Tomorrow - levels for DAX Index
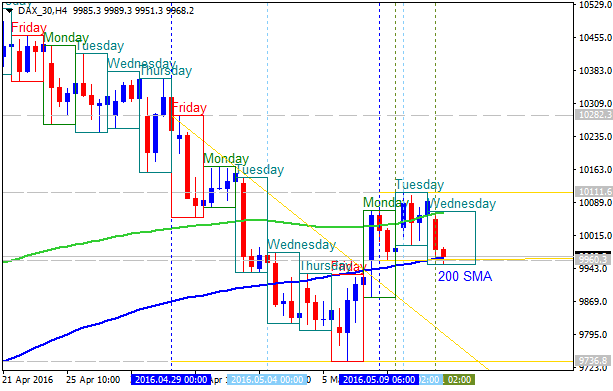
DAX Index: ranging within key narrow level for the bullish trend to be continuing or to the secondary correction to be started. Intra-day H4 price was on bullish breakout: the price crossed Ichimoku cloud to above for the bullish reversal with 10,148 resistance level to be testing for the bullish trend to be continuing. Thus, there are 2 main scenario for the price movement for the week:
- the secondary correction to be started in case the price breaks 10,026 support level to below, or
- the bullish trend will be continuing in case the price breaks 10,148 resistance.

Chinkou Span indicator is located above the price indicating the ranging market condition in the near future, and Absolute Strength indicator is estimating the ranging condition with possible correction to be started.
- if the price breaks 10,148 resistance so the primary bullish trend will be continuing;
- if the price breaks 10,026 support level so the local downtrend as the secondary correction within the primary bullish trend will be started;
- if not so the price will be moved within the channel.
| Resistance | Support |
|---|---|
| 10,148 | 10,026 |
| N/A | 9,548 |
Dax 30 Technical Forecast for May, 2016: bullish ranging reversal
Weekly price is on bearish market condition located below Ichimoku cloud: the price is on ranging within 10,519 resistance and 9,328 support levels with the secondary rally ro be started in the middle of April this year by testing 10,519 level to above with the possible bullish ranging reversal to be started. Chinkou Span line is breaking the price to above on ranging way indicating the ranging bullish reversal, and Absolute Strength indicator is estimating the bullish trend in the near future.
If W1 price will break 10,519 resistance level to above so we may see the reversal to the primary bullish
condition with the secondary ranging (the price will be inside Ichimoku cloud/kumo in this case)
If not so the price will be ranging within the levels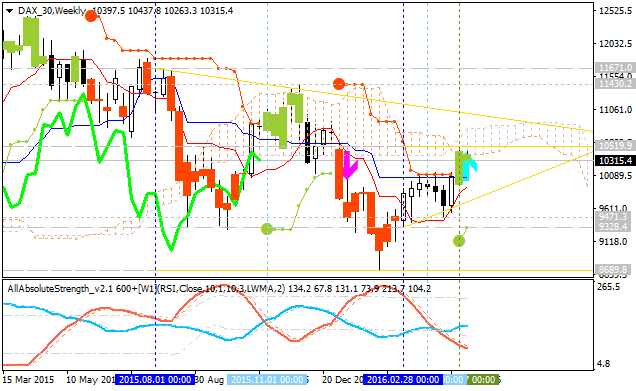
Thus, there are two main scenario for the price movement in May:
- The price will break 10,519 resistance level to above on weekly close bar for the ranging breakout to be started so we may see the reversal of the price movement to the bullish condition in May, and the primary bullish trend up to the end of this year.
- The price will be ranging within 10,519/9,328 levels waiting for direction of the trend.
| Resistance | Support |
|---|---|
| 10,519 | 9,471 |
| 11,430 | 9,328 |
| 11,671 | 8,689 |
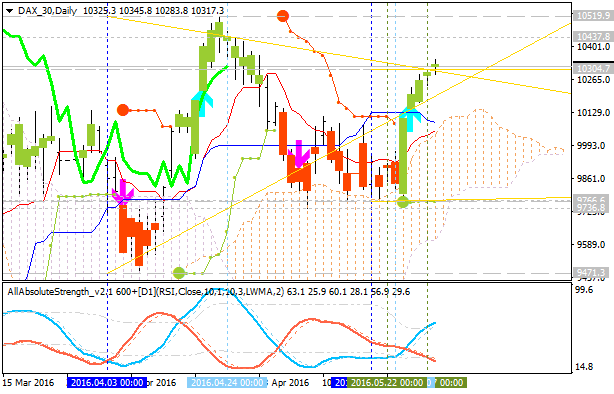
Quick Technical Overview - DAX Index: secondary correction within the primary bullish; waiting for breakdown
Daily price is on secondary correction within the primary bullish market condition: the price was started with the local downtrend in the end of April this year.
- Chinkou Span line is testing the price to below for the good possible breakdown to be started in the near future.
- The price is breaking 10,055.8 support level to below on open daily bar for now for the secondary correction to be continuing.
- Absolute Strength indicator is estimating the correction to be continuing with the possible bearish reversal on the future situation.
- Bearish 'reversal' support level is 9,395.8, and if the price breaks this level to below so we may see the reversal of the price movement from the primary bullish to the primary bearish market condition.
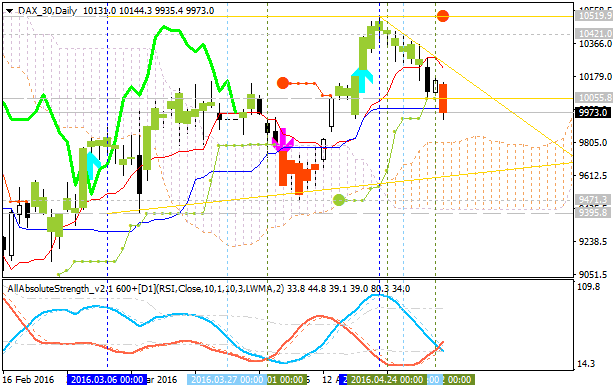
If daily price will break 10,055.8
support level on close bar so the secondary correction will be
continuing.
If not so the price will be on ranging bullish condition within the levels.
DAX Index Technical Analysis for a week: waiting to break the levels
Daily price
is located between SMA with period 100 (100 SMA) and SMA with the period
200 (200 SMA) for the ranging market condition waiting for the direction for the possible breakout or
breakdown. The price is on bearish ranging to be near and below 200 SMA to be ready to be reversed to the primary bullish condition or for the primary bearish trend to be continuing without secondary ranging.
- If the price will break 10,519.9 resistance level so the reversal of the price movement to the primary bullish condition will be started.
- If price will break 9,471.3 support so the bearish trend will be continuing without ranging.
- If not so the price will be ranging within the levels.
| Resistance | Support |
|---|---|
| 10,519.9 | 9,471.3 |
| 11,430.2 | 8,689.8 |
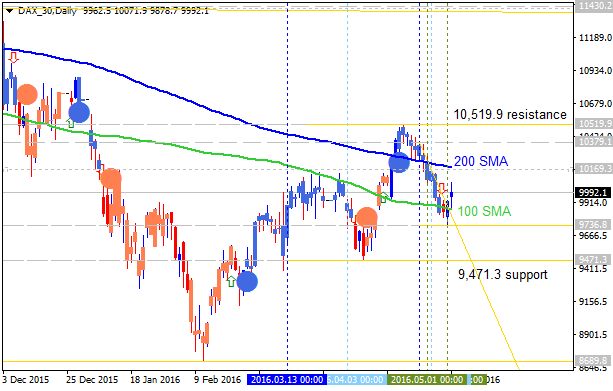
SUMMARY : ranging
Forum on trading, automated trading systems and testing trading strategies
Sergey Golubev, 2016.05.11 13:09
DAX Index Intra-Day Technical Analysis: the trend would no longer be bullish (based on the article)
- "On the DAX 30 sliding below last week’s low of 9739, the trend would no
longer be bullish according to classic technical analysis as the
sequence of higher lows would end. Support levels below last week’s low
of 9739 are the April 7 low of 9433 and the February 24 low of 9122."
- "The next German or European macroeconomic event, which may move the DAX is the release of tomorrow’s Eurozone Industrial Production figures, followed by first quarter German GDP on Friday."
H4 price is on ranging movement from 100 SMA to 200 SMA with 9960.3 support level to be crossed to below for the reversal of the price movement from the ranging bullish to the primary bearish market condition with 9736.8 nearest bearish target.
DAX Index: End Of Week Technicals - daily ranging for direction
This trading week ended with some results and setups - daily ranging within 100 SMA/200 SMA waiting for direction, and ranging bearish market condition
------------------
DAX Index
D1 price is on secondary ranging within 7-day high/low for the waiting for the dierection of the trend: the price is is located to be between 100 SMA and 200 SMA within 10,085.8 resistance and 9,762.4 support levels.
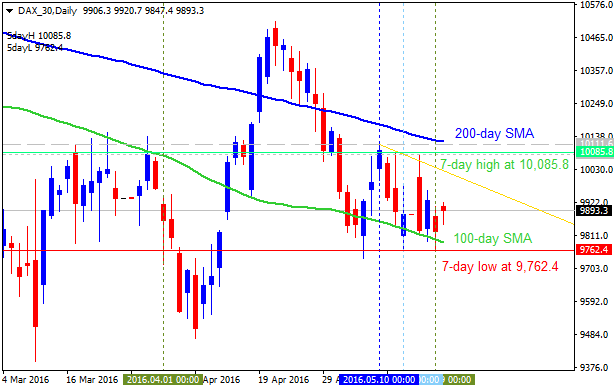
If the price will break 7-day low at 9,762.4 from above to below so the bearish market condition will be continuing without secondary ranging up to the new bottom to be formed.
If not so the price will be on ranging for direction.
| Resistance | Support |
|---|---|
| 10,085.8 | 9,762.4 |
| 10,111.6 | 9,550.8 |
| 10,519.9 | 9,471.3 |
SUMMARY : waiting for direction
DAX Index Technical Analysis 2016, 29.05 - 05.06: daily bullish breakout
Daily price is located above Ichimoku cloud for the bullish market condition: the price is breaking key support level at 10,304.7 together with ascending triangle pattern to above for the breakout within the primary bullish trend with 10,437.8 resistance as the next target to re-enter. Chinkou Span line broke the price to above for the breakout to be started, and Absolute Strength indicator is estimating the bullish condition in the near future.
If D1 price will break 9,736.8
support level on close bar so the reversal of the price movement from the primary bullish to the primary bearish market condition will be started.
If D1 price will break 10,304.7
resistance level on close daily bar from below to above so the bullish breakout will be continuing with 10,437.8 level as a target to re-enter.
If not so the price will be on ranging within the levels.
| Resistance | Support |
|---|---|
| 10,304.7 | 9,736.8 |
| 10,437.8 | 9.471.3 |
SUMMARY : breakout
Forum on trading, automated trading systems and testing trading strategies
Sergey Golubev, 2016.06.07 16:57
Intra-day Technical Analysis - DAX Index: bullish ranging within 20-day high resistance and bearish reversal support (based on the article)
H4 price is on primary bullish market condition for the ranging within the following support/resistance levels:
- 20-day high at 10372.5 level located far above 100 SMA/200 SMA reversal area in the primary bullish area of the chart, and
- 10038.3 support level located near 200 SMA on the border between the primary bearish and the primary bullish trend.
"The 10100/00 area the market is springing to life from holds critical if a higher low is to carve itself out. This area has been in play since early March and continues to be important. A strong showing today (it’s very early, but off to a good start) and break above the Friday high will go a long way towards building the bullish case for a break above the recent swing high at 10374 (5/31). The higher low, higher high sequence from late May should then continue to further itself up to the 4/21 high at 10486 and then possibly to a new high 2016 high, reaching the trend-line running off the 2015 record highs."
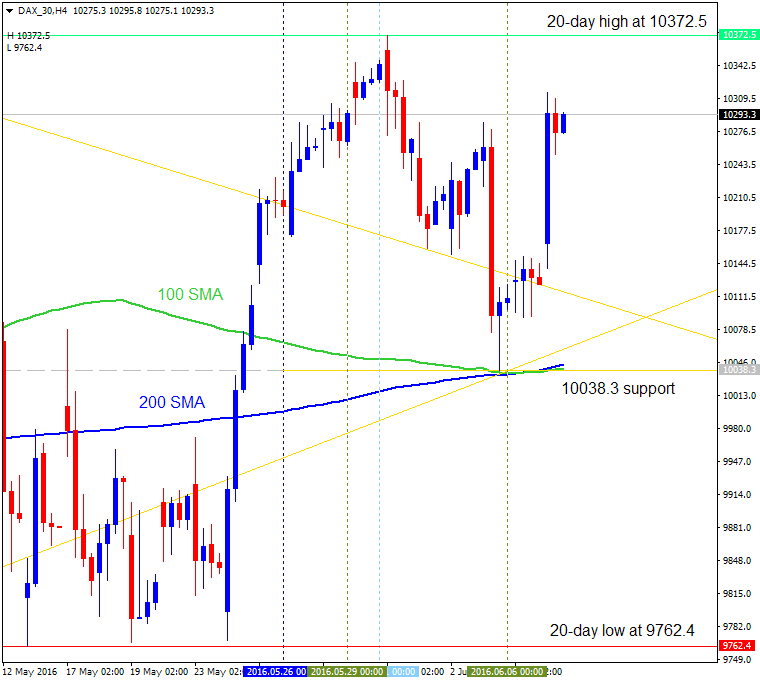
- If the price will break 10372.5 resistance level so the primary bullish trend will be continuing.
- If price will break 10038.3 support so the reversal of the price movement from the primary bullish to the primary bearish market condition will be started.
- If not so the price will be ranging within the levels.
| Resistance | Support |
|---|---|
| 10372.5 | 10038.3 |
| N/A | 9762.4 |
SUMMARY : ranging
- Free trading apps
- Over 8,000 signals for copying
- Economic news for exploring financial markets
You agree to website policy and terms of use
Intra-day Technical Analysis - DAX Index: Bearish Breakdown
H4 price is breaking 200 period SMA to below for the breakdown with the bearish reversal. Key support level at 9583 is going to be broken for the bearish breakdown to be continuing with 9326 next target to re-enter.
SUMMARY : correction to the bearish reversal
TREND : bearish reversal