Forecast for Q2'16 - levels for S&P 500
S&P 500 Pivot Points Analysis - the reversal of the weekly price movement to the long-term bullish market condition
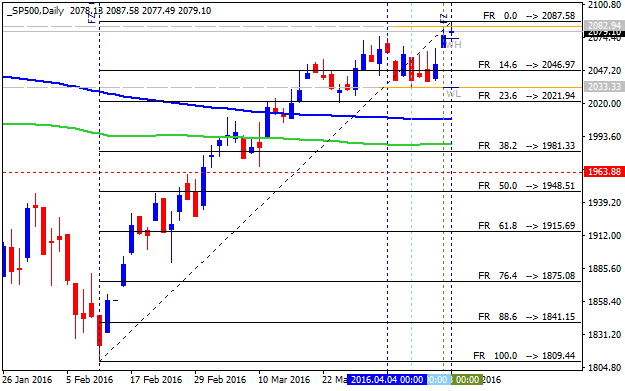
W1 price is on bullish breakout since the beginning of March this year: the price broke Central Yearly Pivot at 2019.77 to above for the reversal of the weekly price movement to the long-term bullish market condition. The price is testing 2074.79 resistance for the bullish breakout to be continuing and with 2116.27 nearest target to re-enter with R1 Pivot at 2176.41 as the global bullish target.

| Instrument | S1 Pivot | Yearly PP | R1 Pivot |
|---|---|---|---|
| SP500 | 1905.11 | 2019.77 | 2176.41 |
Trend:
- W1 - breakout with bullish reversal
Forum on trading, automated trading systems and testing trading strategies
Sergey Golubev, 2016.04.10 08:50
S&P Says Q1:16 Earnings Will Decline 10% (based on the article) 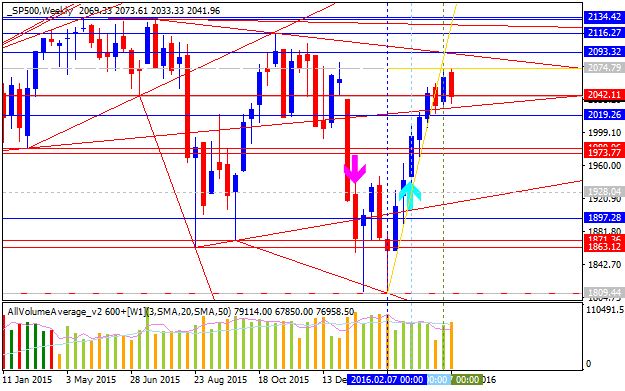
- "The S&P 500 is expected to post a year-on-year decline of 9.1% which will be the fourth consecutive quarter of year-over-year declines, which last happened in Q4:08 through Q3:09. The expected decline in earnings will be the largest expected decline since Q1:09, when the S&P earnings were expected to decline 26.9% from the same quarter in 2008."
- "Of course, the “geniuses” at our Federal Reserve want us to believe them when they say that our economy is booming and deserves a series of rate hikes when the rest of the world central bankers are lowering rates as fast as they can. However, that is for another article on another day."
- "At present, the forward 12 month P/E on the S&P 500 is 16.5 which is higher than the five and ten year averages thanks to the period between 2008 and 2012 when we were in the so-called Great Depression aka the global financial meltdown and the S&P was ravaged."
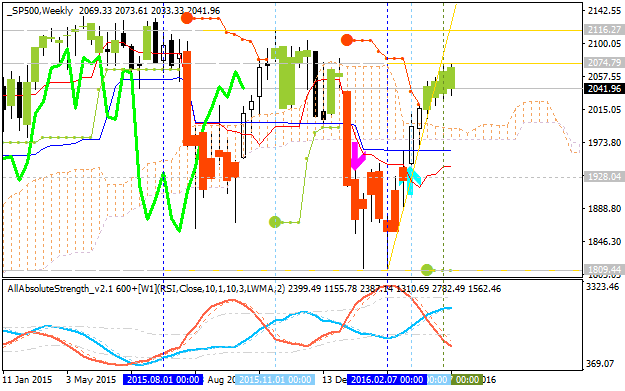
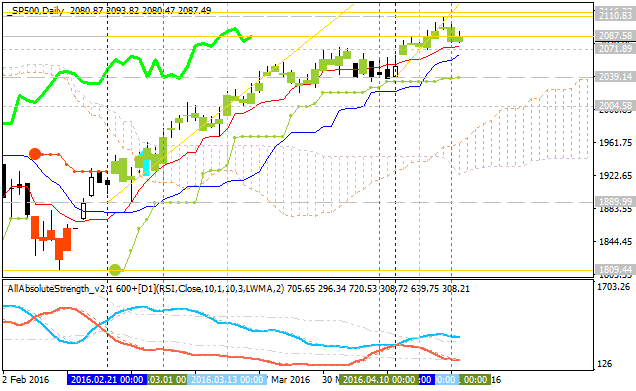
Weekly price - as we see from the chart above, the price is on bullish breakout by breaking Ichimoku cloud to be reversed from the primary bearish to the primary bullish market condition. if the price breaks 2074.79 resistance level to 2116.27 target so the bullish breakout will be continuing. Bearish reversal level is 1928.04 so if the price breaks this level to below so the bearish trend will be started on this timeframe.
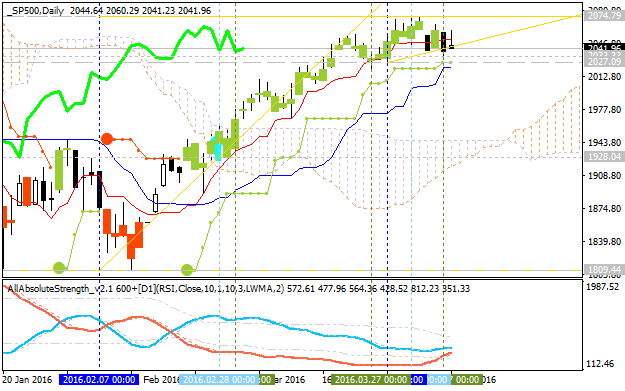
Daily price is on bullish trend located far above Ichimoku cloud: the price is ranging within the following narrow s/r levels: 2074.79 bullish resistance level and 2027.09 support level. If the price breaks 2074.79 so the bullish trend will be continuing, if the price breaks 2027.09 support level to below so the secondary correction within the primary bullish trend will be started.
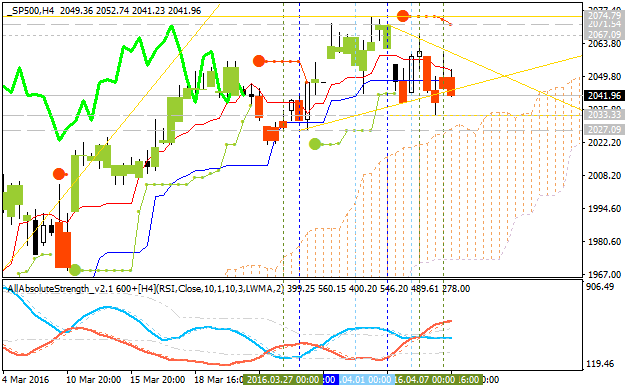
H4 price is on ranging correction within the primary bullish market condition: the price is breaking symmetric triangle pattern to below for the secondary correction to be continuing with 2027.09 support level as the bearish reversal target.
Quick Technical Overview - S&P 500: ranging near key resistance for the bullish trend to be continuing
S&P 500: ranging bullish. Daily price broke 200-day SMA (200 SMA) and 100-day SMA (100 SMA) to above for the bullish reversal: the price is on bullish ranging within key reversal s/r levels for the bullish trend to be continuing or to the daily bearish reversal:
- 2087.58 resistance level located above 200 SMA/100 SMA reversal on the primary bullish area of the chart, and
- 1981.33 support level located near and below 100 SMA/200 SMA in the beginning of the bearish area of the daily chart.
Most likely scenario for the price in a medium-term situation is for the bullish trend to be continuing by 2087.58 resistance level to be broken. Anyway, the bearish breakdown level at 1963.88 is located not too far from the market price which makes a bearish reversal in the way of breakdown is very possible in the future for example.
| Resistance | Support |
|---|---|
| 2087.58 | 1981.33 |
| N/A | 1963.88 |
S&P 500 Technical Analysis 2016, 24.04 - 01.05: bullish ranging within narrow s/r levels
Daily price
is on bullish market condition located above Ichimoku cloud and above
Senkou Span line which is the virtual border between the primary bearish
and the primary bullish trend on the chart. The price is ranging within
narrow support/resistance level for the bullish trend to be continuing
or to the secondary correction to be started.
The price is ranging within the following key support/resistance lines:
- 2110.83 key resistance line located far above Ichimoku cloud in the bullish area of the chart, and
- 2039.14 key support level located on the beginning of the secondary ranging trend on the chart.
Chinkou Span line is located above the price indicating the bullish trend to be continuing, and Absolute Strange indicator is evaluating the price movement as the secondary ranging condition to be continuing.
If D1 price will break 2039.14 support level on close bar so the local downtrend as the secondary correction within the primary bullish market condition will be started.If D1 price will break 2110.83 resistance level on close bar from below to above so the bullish trend will be continuing.
If not so the price will be on ranging within the levels.
| Resistance | Support |
|---|---|
| 2110.83 | 2039.14 |
| N/A | 2004.58 |
Quick Technical Overview - S&P 500: bullish ranging to the secondary correction
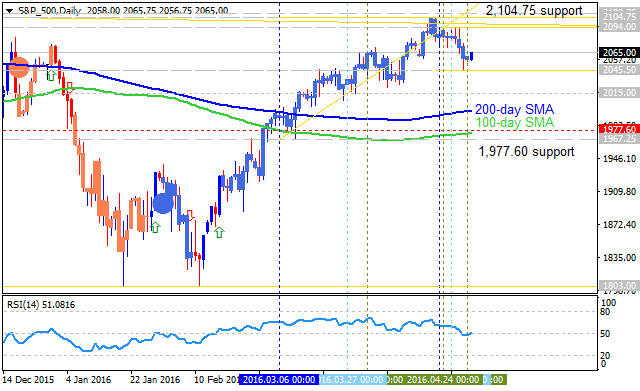
Daily price is on bullish market condition with above of 100-day SMA (100 SMA) and 200-day SMA (200 SMA):
- the price is on ranging within 2,104.75 resistance and 2045.50 support level;
- if the resistance level at 2,104.75 will be broken by the price to above so the primary bullish trend will be continuing;
- if support level at 2,045.50 is going to be broken by the price to below so the secondary correction within the primary bullish market condition will be started;
- RSI indicator is estimating the ranging condition to be continuing in the near future;
- key 'reversal' support level for daily S&P 500 is 1,977.60, and if the price breaks this level to below so the reversal of the price movement from the primary bullish to the primary bearish condition will be started;
- nearest support levels are 2,045.50 and 1,977.60;
- nearest resistance levels are 2,104.75 and 2,109.75.
| Resistance | Support |
|---|---|
| 2,104.75 | 2,045.50 |
| 2,109.75 | 1,977.60 |
- if daily price
breaks 2,104.75 resistance so the primary bullish trend will be continuing;
- if daily price breaks 2,045.50 support level so the local downtrend as the secondary correction within the primary bullish trend will be started;
- if not so the price will be moved within the levels.
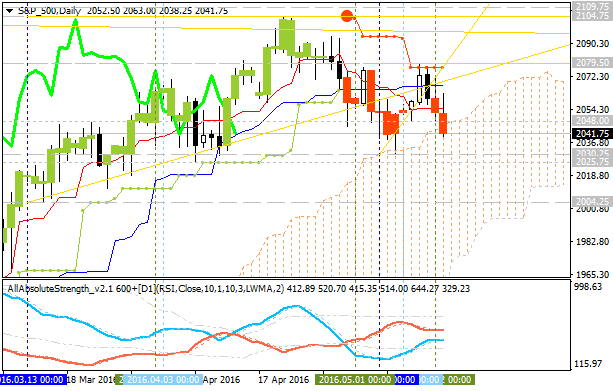
S&P 500 Technical Analysis: bullish ranging breakdown
Daily price
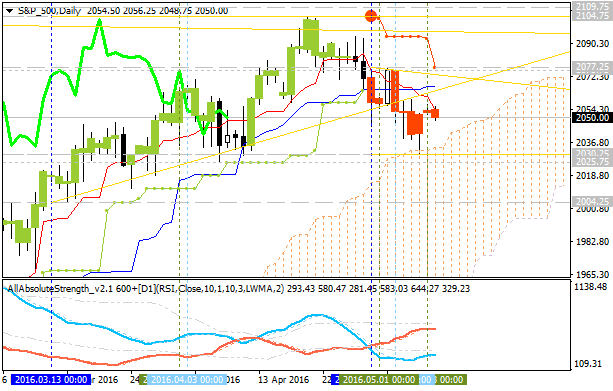
is on bullish ranging breakdown: the price is on secondary correction by breaking key support levels with the Chinkou Span line which was crossed the price to below in the ranging way of direction. Symmetric triangle pattern was broken by the price to below for the secondary correctional breakdown to be continuing, and Absolute Strength indicator is estimating the ranging condition to be started.
If D1 price will break 2104.75 resistance level on close bar from below to above so the bullish trend will be continuing.
If not so the price will be on ranging within the levels.
| Resistance | Support |
|---|---|
| 2077.25 | 2030.25 |
| 2104.75 | 2004.25 |
S&P 500 Price Action Analysis - bullish ranging within 30-day low/30-day high area
Daily price is located above 200 period SMA (200 SMA) and 100 period SMA (100 SMA) for the primary bullish market condition.
- The price is ranging between ranging between 30-day low at 2,025.75 and 30-day high at 2,104.75;
- 'Reversal' 200-day SMA is located new and below 30-day low, and if the price breaks this level so the reversal of the price movement from the ranging bullish to the ranging bearish market condition will be started.
- RSI indicator is estimating the ranging bullish trend to be continuing.

- If the price will break 2,104.75 resistance level so the primary bullish trend will be continuing without ranging.
- If price will break 2,025.75 support level so the bearish reversal will be started with the secondary ranging condition.
- If not so the price will be ranging within the levels.
| Resistance | Support |
|---|---|
| 2,104.75 | 2,030.25 |
| 2,109.75 | 2,025.75 |
SUMMARY : ranging
S&P 500 Technical Analysis 2016, 15.05 - 22.05: breakdown to the ranging bearish reversal
Daily price
is on possible bearish reversal to be started on daily open bar for now: the price is breaking Senkou Span line which is the virtual border between the primary bearish and the primary bullish trend on the chart. Chinkou Span line is breaking the price to below as well for the breakdown with possible bearish reversal to be started, and Absolute Strength indicator is estimating the ranging bearish condition to be in the near future.
If the price breaks Senkou Span line together with 2,030.25 support level so the bearish reversal will be started with the secondary ranging market condition: the price will be inside Ichimoku cloud.
If not so the price will be on ranging within the levels.
| Resistance | Support |
|---|---|
| 2,079.50 | 2,030.25 |
| 2,109.75 | 2,004.25 |
Forum on trading, automated trading systems and testing trading strategies
Something Interesting in Financial Video May 2016
Sergey Golubev, 2016.05.21 15:40
How To Trade the S&P 500This is just an example of the market analysis for S&P 500
S&P 500 Technical Analysis - 30-day high at 2103.50 is going to be testing for the bullish trend to be continuing
Daily price
is located above 100-day SMA and 200-day SMA for the primary bullish market condition. The price is on ranging within 30-day low at 2021.75 level and 30-day high at 2103.50.
Resistance level at 2103.50 is testing by the price to above for the bullish trend to be continuing. Alternative, if the price breaks 30-day low at 2021.75 to below so the reversal of the price movement from the primary bullish to the primary bearish condition will be started.
| Resistance | Support |
|---|---|
| 2103.50 | 2021.75 |
| N/A | 1803.00 |
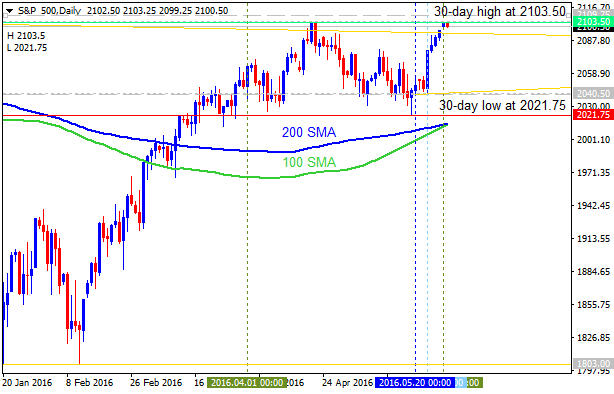
There are two most likely scenarios for the daily price:
- the price breaks 2103.50 level on close daily bar for the continuation of the bullish trend, or
- the price will be on bullish ranging within the levels.
- Free trading apps
- Over 8,000 signals for copying
- Economic news for exploring financial markets
You agree to website policy and terms of use
S&P 500 Long-Term Technical Analysis: bullish breakout near 100/200 SMA ranging area
Weekly price is on bullish breakout started in the middle of February this year: the price broke 100 period SMA to above from the ranging bullish to the primary bullish market condition with ascending triangle pattern to be formed for the bullish trend to be continuing. The price is breaking 2056.31 key resistance on close weekly bar for the key resistance at 2116.27 as the nearest bullish target to re-enter.