about USDJPY H1 Forecast & Analysis
- Thenkansen = tenkan-sen (or tenkan)
- Gumo - kumo?
Why are you naming it on different way?
For example: I am not a coder, and I am not moderating/replying on programming posts because of that.
Are you technical analysis analytic?
===
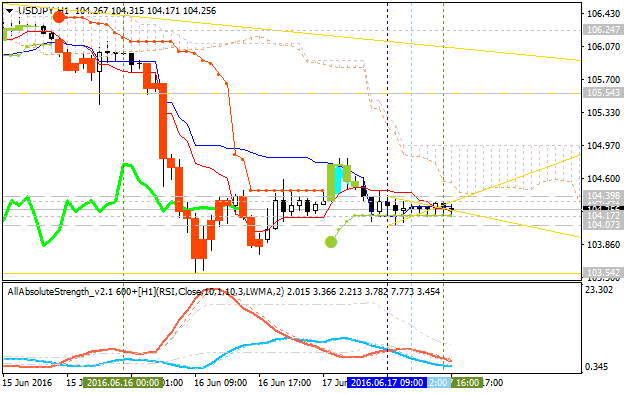
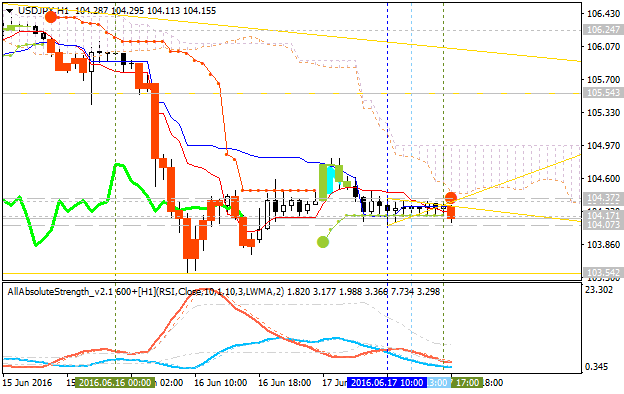
As we see from the image above - the price is on flat condition to be ranging within narrow s/r levels:
- 104.39 resistance level located near Senkou Span line on the border between the primary bearish and the ranging bullish market condition, and
- 104.07 support level located below kumo in the primary bearish area of the chart.
If H1 price breaks 104.39 resistance to above so the bullish reversal will be started on the secondary ranging way.
If H1 price breaks 104.07 support level to below so tjhe primary bearish trend will be continuing.
- Thenkansen = tenkan-sen (or tenkan)
- Gumo - kumo?
Why are you naming it on different way?
For example: I am not a coder, and I am not moderating/replying on programming posts because of that.
Are you technical analysis analytic?
===
As we see from the image above - the price is on flat condition to be ranging within narrow s/r levels:
- 104.39 resistance level located near Senkou Span line on the border between the primary bearish and the ranging bullish market condition, and
- 104.07 support level located below kumo in the primary bearish area of the chart.
If H1 price breaks 104.39 resistance to above so the bullish reversal will be started on the secondary ranging way.
If H1 price breaks 104.07 support level to below so tjhe primary bearish trend will be continuing.
Sorry, I miss.
tenkan_sen and kumo are right.
Thanks.
I am a trader now and in the near future I am dreaming to be a programmer.
Now chikou span is moving over past candle.
Do you think it is buying signal?
And not yet. Because it is crossed on open H1 bar for now, and not at acute angle.
Besides, Chinkou Span/price is very strong signal but the lagging one.
Forum on trading, automated trading systems and testing trading strategies
USDJPY Technical Analysis 23.06 - 30.06 : Rally Finishing to Ranging
Sergey Golubev, 2013.06.27 12:07
Well ... what I am explaining here by text and charts - it is understandable for traders. But there are traders and coders on the forum. And I think we all know that they are using different "forex english" in some cases. So, I am just translating some terms/words I am using for technical Ichimoku analysis onto "coding english" language :) :
- Tenkan Sen - moving average of the highest high and lowest low over the last 9 trading days. (Highest high + Lowest low) / 2 over the last 9 trading days
- Kijun Sen - moving average of the highest high and lowest low over the last 26 trading days. (Highest high + Lowest low) / 2 over the last 26 trading days.
- Senkou Span A - the average of the Tenkan Sen and Kijun Sen, plotted 26 days ahead. (Tenkan Sen + Kijun Sen) / 2 plotted 26 days ahead
- Senkou Span B - the average of the highest high and lowest low over the last 52 days, plotted 26 days ahead. (Highest high + Lowest low) / 2 over the last 52 trading days plotted 26 days ahead.
- Chikou Span - the closing price plotted 26 days behind.
Forum on trading, automated trading systems and testing trading strategies
Market Condition Evaluation based on standard indicators in Metatrader 5
Sergey Golubev, 2013.06.28 18:00
as to lower timeframe ... the default settings of Ichimoku is 9/26/52, right? But it is mainly for higher timeframe (started from H1 for example). For lower timeframe - there are 2 kinds of settings:
- 9/26/52 as default one and/or
- 72/144/288
=========
Besides, there are many signals of Ichimoku indicator to open the trades. I know about 6 signals (but it is much more signals in combination with each other):
- Tenkan Sen / Kijun Sen Cross - very weak signal but it is coming as the first one ... but it may be a lot of false signals
- price crossing Kijun Sen - more strong signal
- price crossing Sinkou Span A line (Kumo Breakout)
- price crossing Sinkou Span B line (Kumo Breakout)
- Senkou Span A crossing the Senkou Span B (trend reversal)
- Chikou Span crossing historical price - it is most strong signal for Ichimoku but it is lagging on timeframes started with H1, and not lagging for lower timeframes.
The combination of all those 6 signals = Ichimoku indicator.
So, the request about alert ... it is the request to create alet for all those signals with combination with each other? if yes so it is big project ... I do not have the credits in my profile for all those alerts (which may be - more than 100 different variations) :) ... if you are talking about some particular signal so - it may be possible to make alert.
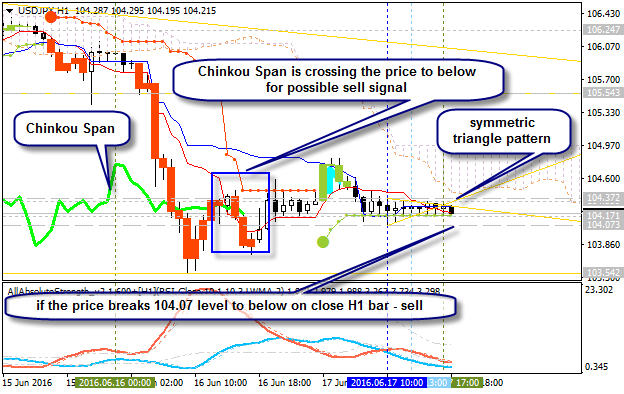
I am mostly using on the thread just one signal : Chikou Span crossing historical price. So, which signal to be alert?
Movint to below (crossing past candle to below means: possible sell signal).
And not yet. Because it is crossed on open H1 bar for now, and not at acute angle.
Besides, Chinkou Span/price is very strong signal but the lagging one.
Chikou span is passing the second lowest past price and kumo highest point now.
And Support of Fobonacci 23.6% retracement is being efficient continually.
I think it is a very strong signal.
Not sell yet (Chinkou Span should cross the price on close H1 bar in case of H1 chart for example):
I agree with you.
I think it is the most powerful signal, chikou span crossing historical price.
Not sell yet (Chinkou Span should cross the price on close H1 bar in case of H1 chart for example):
In next hour candle will meet the lowest point of kumo.
And chinkou span locates below the highest value of historical kumo.
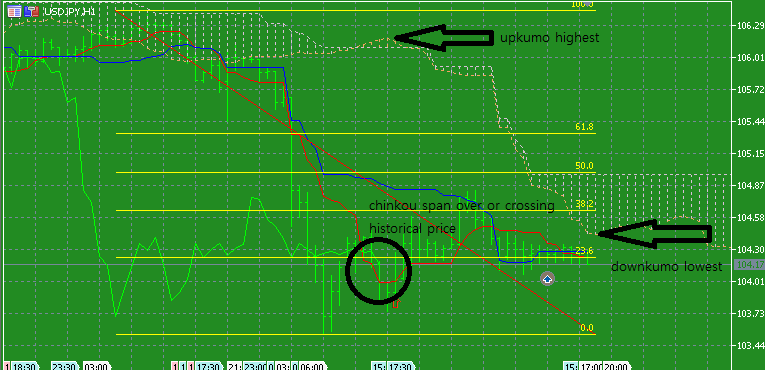
I think next hour can be a critical point.
But Tenkan-sen crossed Kijun-sen on close bar so ... waiting for this bar to be closed.
- Free trading apps
- Over 8,000 signals for copying
- Economic news for exploring financial markets
You agree to website policy and terms of use
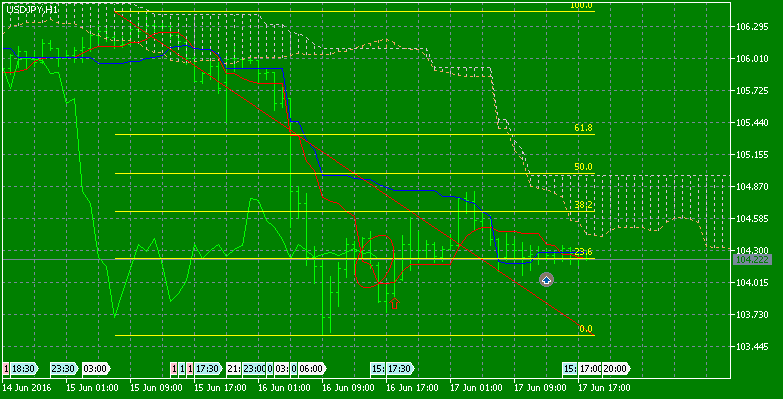
This stage is continuing Fibonacci 23.6% retracement.
MetaTrader Trading Platform Screenshots
USDJPY, H1, 2016.06.17
MetaQuotes Software Corp., MetaTrader 5, Demo
Thekansen is downing but Kijunsen is upward.
Above Gumo is waiting in order to resist.
Chikou span is crossing past candle over past Thenkansen.
I think if Fibonacci 23.6% retracement is real, downtrend of USDJPY is changing.
What's your opinion?