Something Interesting in Financial Video September 2015
Neural Networks Explained in Plain English with Ron Leplae
The goal of the webinar is to demystify neural networks, explain neural networks in plain English, and share easy to understand code examples how NN can be used.
- Artificial Intelligence: History and Background
- Neural Networks: The Basics
- Case Example
- Problems with Neural Networks
- Solutions to common problems with Neural Networks
Forum on trading, automated trading systems and testing trading strategies
Something Interesting in Financial Video October 2013
Sergey Golubev, 2013.09.30 11:19
Interview With Richard Duncan, Author of The New Depression
==========
Richard Duncan's web site: http://www.richardduncaneconomics.com
Richard Duncan is author of the following book :
The New Depression: The Breakdown of the Pap
When the United States stopped backing dollars with gold in 1968, the nature of money changed. All previous constraints on money and credit creation were removed and a new economic paradigm took shape. Economic growth ceased to be driven by capital accumulation and investment as it had been since before the Industrial Revolution. Instead, credit creation and consumption began to drive the economic dynamic. In The New Depression: The Breakdown of the Paper Money Economy, Richard Duncan introduces an analytical framework, The Quantity Theory of Credit, that explains all aspects of the calamity now unfolding: its causes, the rationale for the government's policy response to the crisis, what is likely to happen next, and how those developments will affect asset prices and investment portfolios.
In his previous book, The Dollar Crisis (2003), Duncan explained why a severe global economic crisis was inevitable given the flaws in the post-Bretton Woods international monetary system, and now he's back to explain what's next. The economic system that emerged following the abandonment of sound money requires credit growth to survive. Yet the private sector can bear no additional debt and the government's creditworthiness is deteriorating rapidly. Should total credit begin to contract significantly, this New Depression will become a New Great Depression, with disastrous economic and geopolitical consequences. That outcome is not inevitable, and this book describes what must be done to prevent it.
- Presents a fascinating look inside the financial crisis and how the New Depression is poised to become a New Great Depression
- Introduces a new theoretical construct, The Quantity Theory of Credit, that is the key to understanding not only the developments that led to the crisis, but also to understanding how events will play out in the years ahead
- Offers unique insights from the man who predicted the global economic breakdown
Alarming but essential reading, The New Depression explains why the global economy is teetering on the brink of falling into a deep and protracted depression, and how we can restore stability.
=========
Here's a summary of the points discussed:
1. The book starts with a discussion of fractional reserve banking,
observing the connection between debt and money and how debt and
inflation go together.
2. Richard views the current monetary system as flawed and in trouble,
but does not view a return to a gold standard of any kind as possible.
Rather, he thinks the best hope is for governments to attempt to borrow
at very low rates and invest not in consumption but in growth -- invest
in projects that will offer a high economic return. He cites investing
in a new energy grid as an example.
3. Richard does not view China dumping US Treasuries, or the world
decoupling from the dollar as a viable threat. This seems to be part of
why he believes there are a few more years left where low interest rates
are achievable.
4. In terms of investments, Richard favors real estate that can be turned into rental income. He finds public stocks to be a bit too close to the derivatives crisis, and does not think gold is immune to a severe decline if growth cannot be obtained.
Forum on trading, automated trading systems and testing trading strategies
Something Interesting in Financial Video May 2014
Sergey Golubev, 2014.05.23 18:35
The Crab Pattern - Harmonic Ratios and Explanation :
The Deep Crab Pattern - Harmonic Ratios and Explanation :
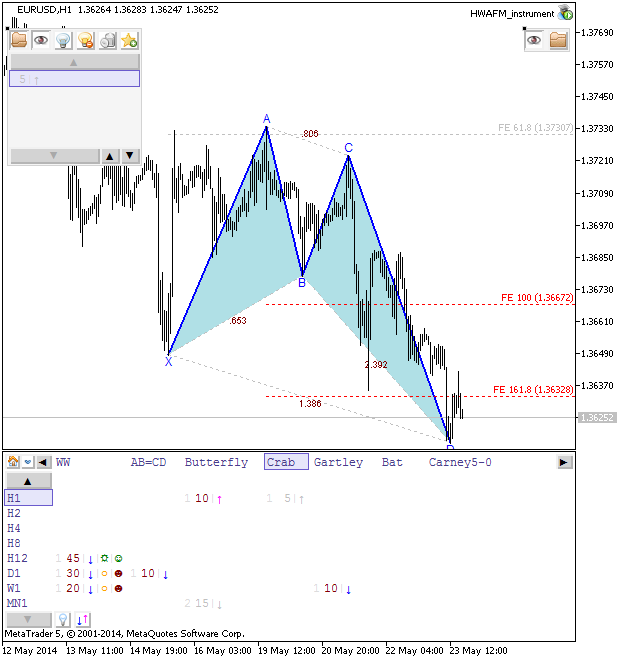
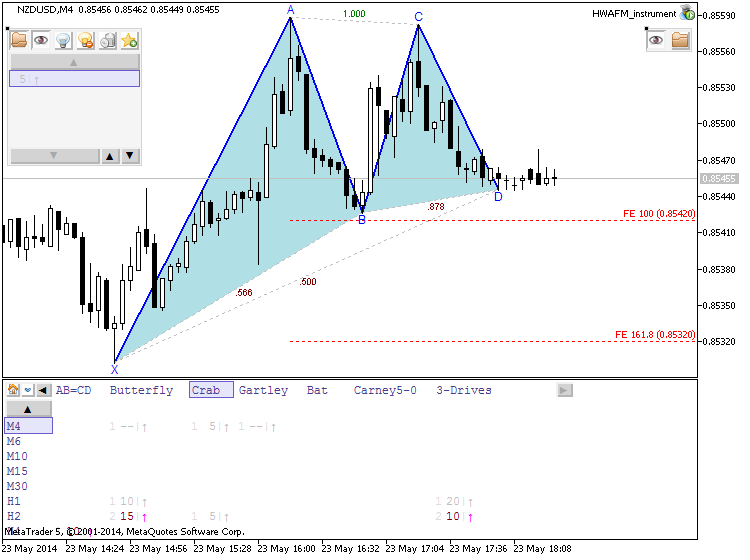
The charts were made by using free HWAFM tool for Metatrader 5
Stock Market Review Ichimoku, Candlestick and Fibonacci analysis for September 3rd 2015
Forum on trading, automated trading systems and testing trading strategies
Something Interesting in Financial Video May 2014
Sergey Golubev, 2014.05.22 10:30
Strategy Video: Strategy For Low and Extreme Volatility Conditions
- The VIX Volatility Index slipped below 12% for only the third time in the past 7 years
- Activity levels in the FX and other financial markets are equally extreme
- While these exceptional conditions will eventually reverse, we should think of more timely strategies
Volatility readings slid to extreme lows this past session - implying a correction in activity levels and markets may soon be at hand. From the equities-based VIX, a slide between 12 percent draws us to levels only seen two other times in the past seven years. Readings in FX and other financial assets have sported similar elevations. Our natural inclination is to project a reversal to match the magnitude of our current extremes. However, that eventual systemic change may take time and numerous false starts. There are more immediate opportunities for oscillations in activity levels. We look at this situation from a short, medium and long-term perspective while also highlighting the different trade options through the scale in today's Strategy Video.
The $VIX is the 30-day annualized implied volatility of the S&P 500 Index Options. In addition, the $VXN is the 30-day annualized implied volatility of the Nasdaq 100 Index Options. When markets crash or move downward quickly, put options become popular. Traders bid up the price of these put options, which manifests itself as an increase in the implied volatility level; thus an increase in the $VIX and $VXN index. The basic relationship between stock and index prices and the $VIX and $VXN is presented next:
- When prices fall, the $VIX and $VXN Indexes rise.
- In contrast, when prices rise, the $VIX and $VXN Indexes fall.
This basic relationship is summed up by a famous traders' saying: "When the VIX is high it's time to buy; when the VIX is low it's time to go."
The following chart of the S&P 500 exchange traded fund (SPY), top half
of chart, shows the inverse relationship between it and the $VIX Volatility
Index, bottom half of chart:
Notice how an uptrend in the price of the S&P 500 is accompanied by a downtrend in the level of the $VIX.
The next chart of the Nasdaq 100 exchange traded fund (QQQQ) shows how great
buying opportunities are when the $VXN spikes higher:
When the $VIX or $VXN spike (usually they both spike during the same periods) buy. If history repeats itself, which it has done often, buying $VIX and $VXN spikes has proven quite profitable. Nevertheless, the Mutual Fund mantra applies: "Past performance is not indicative of future performance".
The trend of the $VIX and $VXN Indexes can add another helpful level of analysis to price and volume indicators. A technical indicator that might be of interest is the Volatility indicatorForum on trading, automated trading systems and testing trading strategies
Something Interesting in Financial Video May 2014
Sergey Golubev, 2014.05.21 10:08
How To Use Fibonacci Retracements
Fibonacci Retracements can help traders find significant price points
and predict levels of support and resistance. It is based on the
Fibonacci sequence of numbers, identified by Leonardo Fibonacci in the
thirteenth century. The relationships between those numbers are shown
as ratios, and those ratios are used to identify possible reversal
levels.
Forum on trading, automated trading systems and testing trading strategies
Something Interesting in Financial Video August 2013
Sergey Golubev, 2013.08.24 08:28
80. Who Really Controls the Forex Market?As we discussed in our last lesson the forex market is an over the counter market meaning that there is no centralized exchange where all trades are made. Because of this, the price that someone receives when trading forex has traditionally differed depending on the size of the transaction and the sophistication of the person or entity that is making that transaction.
At the center or first level of the market is something known as the Interbank market. While technically any bank is part of the Interbank market, when an FX Trader speaks of the interbank market he or she is really talking about the 10 or so largest banks that make markets in FX. These institutions make up over 75% of the over $3 Trillion dollars in FX Traded on any given day.
There are two primary factors which separate institutions with direct interbank access from everyone else which are:
1. Access to the tightest prices. We will learn more about transaction costs in later lessons however for now simply understand that for every 1 Million in currency traded those who have direct access to the Interbank market save approximately $100 per trade or more over the next level of participants.
2. Access to the best liquidity. As with any other market there is a certain amount of liquidity or amount that can be traded at any one price. If more than what is available at the current price is traded, then the price adjusts until additional liquidity enters the market. As the forex market is over the counter, liquidity is spread out among different providers, with the banks comprising the interbank market having access to the greatest amount of liquidity and then declining levels of liquidity available at different levels moving away from the Interbank market.
In contrast to individuals who make a deposit into their account to trade, institutions trading in the interbank market trade via credit lines. In order to get a credit line from a top bank to trade foreign exchange you must be a very large and very financially stable institution, as bankruptcy would mean the firm that gave you the credit line gets stuck with your trades.
The next level of participants are the hedge funds, brokerage firms, and smaller banks who are not quite large enough to have direct access to the Interbank market. As we just discussed the difference here is that the transaction costs for the trade are a bit higher and the liquidity available is a bit lower than at the Interbank level.
The next level of participants has traditionally been corporations and smaller financial institutions who do make foreign exchange trades, but not enough to warrant the better pricing
As you can see here, traditionally as the market participant got smaller and less sophisticated the transaction costs they paid to trade became larger and the liquidity that was available to them got smaller and smaller. In a lot of cases this is still true today, as anyone who has ever exchanged currencies at the airport when traveling knows.
To give you an idea of just how large a difference there is between participants in the Interbank market and an individual trading currencies for travel, Interbank market participants pay approximately $.0001 to exchange Euros for Dollars where Individuals in the airport can pay $.05 or more. This may not seem like much of a difference but think about it this way: On $10,000 that is $1 that the Interbank participant pays and $500 that the individual pays.
The landscape for the individual trader has changed drastically since the internet has gone mainstream however, in many ways leveling the playing field and putting the individual trader along side large financial institutions in terms of access to pricing and liquidity. This will be the topic of our next lesson.
Forum on trading, automated trading systems and testing trading strategies
Something Interesting in Forex Video May 2013
Sergey Golubev, 2013.05.02 15:03
This is very short video of 3 minutes 17 seconds: Why Watching the News Can Hurt Your Trading by Alexander Elder - trader and author, explains why he feels business TV can be detrimental to one's trading and believes standing aside can sometimes be the best approach.
Who is Alexander Elder? read this article Interview with Dr. Alexander Elder: "I want to be a psychiatrist in the market"
Forum on trading, automated trading systems and testing trading strategies
Something Interesting in Financial Video September 2014
Sergey Golubev, 2014.09.17 17:02
Quants: The Alchemists of Wall Street - A Documentary about algorythmic tradingJohn Ehlers - Anticipating Turning Points - webinar
- Market Data is Fractal -- Longer waves have bigger swings than shorter waves.
- Spectral Dilation describes data over the full range of tradable cycles.
- Aliasing noise swamps shorter wave data.
- Aliasing noise is best removed using a SuperSmoother filter.
- Spectral Dilation effects are mitigated by a Roofing Filter.
- Price turning points must be anticipated for effective swing trading.
- Trading System Performance is best evaluated using Monte Carlo techniques.
- Free trading apps
- Over 8,000 signals for copying
- Economic news for exploring financial markets
You agree to website policy and terms of use
Please upload forex video you consider as interesting one. No direct advertising and no offtopic please.
The comments without video will be deleted.