Reasoning: How do you become a millionaire? Or .... - page 11
You are missing trading opportunities:
- Free trading apps
- Over 8,000 signals for copying
- Economic news for exploring financial markets
Registration
Log in
You agree to website policy and terms of use
If you do not have an account, please register
No, the market chart has many dimensions and each one has a different trend. And of course the direction depends on the dimension (roughly the timeframe)
Superposition of trends)
That's what the lack of a definition of 'trend' shows...
Most traders confuse the terms "trend" and "price saw"...
"Price sawing" is price spikes in one direction or another, and on every chart this "sawing" will be different, unique...
"Trend" is the overall DIRECTION of the "price saw", and it will be ONE at the current moment in time, and is independent of price spikes... or the chart... The trend is not on the chart, but on the MARKET!
The short-term direction of the price, opposite to the trend, is called a SEND...
If we don't agree on definitions, all this talk will go nowhere.
Very simple: you open cent accounts at dubious brokers who have cent accounts on the same servers together with dollar accounts. A total of 8 (the more the better). In each month, you spend once a month on all accounts: 4 of them in buy, the other 4 - in sell, up to 100 and above up to 299%. Then you open small trades the whole month to give an impression of trading. The more chaotic the balance line is, the less doubts the subscribers will have. And so on, in the next month 2 on buy, 2 on sell, then 1 on buy, 1 on sell, for the fourth month one signal remains.
You can see there, a man has already had 300 accounts lost, and still people sign up for him, collecting 100,000 in investments).
That's what the lack of a definition of 'trend' shows...
Most traders confuse the terms "trend" and "price saw"...
"Price saw" is price spikes in one direction or another, and on every chart such a "saw" will be different, unique...
"Trend" is the general direction of the "price saw", and it will be ONE at the current moment in time, and is independent of price jumps... or the chart... The trend is not on the chart, but on the MARKET!
A short-term price direction opposite to the trend is called a SEND...
If we don't agree on definitions, this whole conversation will go nowhere.
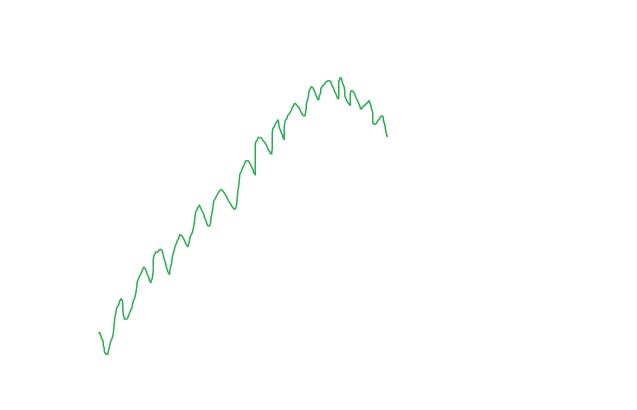
I will refer to the price movement from point A to point B as a trend.
The price can reach point B directly or by deviations.
The deviations in turn represent the same price movement but on a smaller scale.
So we obtain a fractal structure. For the market, the structure is still multifractal.
And so it goes deeper up to the tick chart.
The price movements are caused by the fact that they sell on the ascending market and buy on the descending one.
Money does not appear on the market out of thin air. Someone has to eat someone)) - Well, this is my opinion)
you look at it, the man has already lost 300 accounts, and still they sign up for him, collecting 100,000 in investments)
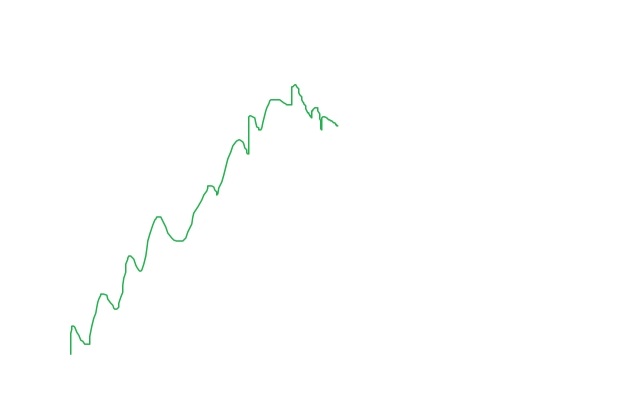
ZZ is good for trend detection. You can see peaks and troughs. A sequence of peaks and troughs can characterise a trend.
The tops and troughs do not always form a trend. You should keep that in mind.
Each ZZ knee is considered as a wave by me. It is so convenient to form the structure of waves. Each wave has its own channel.
Each TF has its own channels and channels of lower and upper TFs.
If you are interested? I'll bash the tale further))
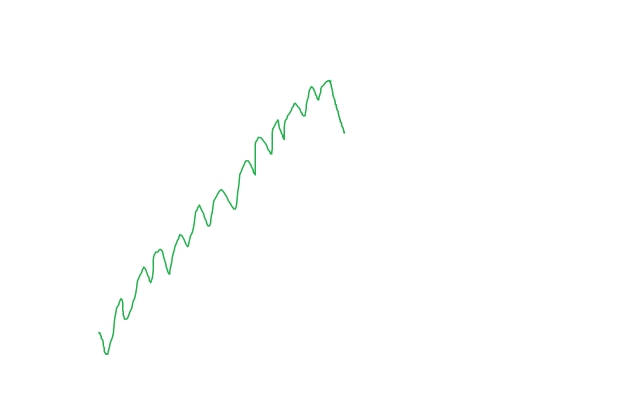
can a trend-following strategy be traded on a flat chart? if the chart is flat on all timeframes, "self-similar".
A trend-follower would see a trend reversal here.
and a flatlander will see a deviation from the swing and will trade up
I will call a trend a price movement from point A to point B.
Price can reach point B either directly or by deviating.
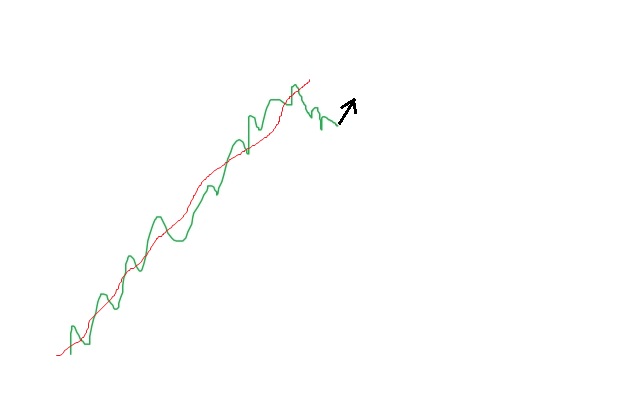
... that's my opinion)For me it is better (more illustrative) to consider the average channel line ...
Yeah, like the Chukcha - what I see is what I sing...
This is not the way to do good things!
Think again... There can be ONLY ONE TREND DIRECTION in the market at the current moment in time! And this direction is in no way dependent on the timeframe...EH!!!
The odd man knows that there is ONLY ONE trend direction at the moment, and that is the direction of the tick)))
No, the market chart has many dimensions and each has a different trend. And naturally, the direction depends on the dimension (roughly, on the timeframe).
It cannot be any other way.
is it possible to trade a trending strategy on a flat chart? if the chart is flat on all timeframes, "self-similar".
a trend-follower will see a trend reversal here
and a flatlander will see a deviation from the swing and will trade up
That's if you look narrowly through the gap, you can only see a currency pair.
But if you open the door a little and open your eyes, you can look at currencies.
That's where you can see the trend and the flat.
...
OK, he turns around like this.
But if it turns sharply.
you can't tell if it's a U-turn or if it's just a little bit more than usual.