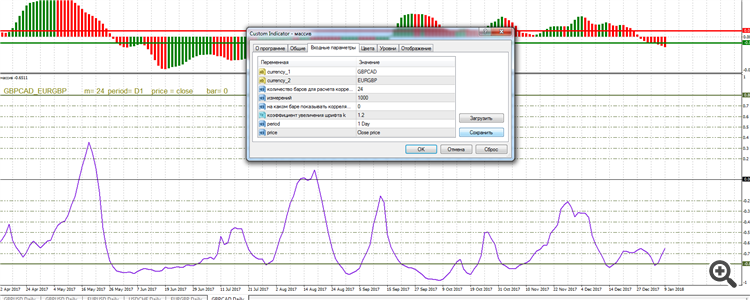
Correlation indicator.
Friends, I need your opinion. I have written a Pearson correlation indicator in the form of a line between two pairs and in the form of a table of currency pairs, stocks and indices.
1) as a line
m=24 - number of bars for calculating the correlation between pairs
period=D1 - daily chart
price=close - closing prices;
bar=0 - 24 bars by close prices beginning from zero.
In principle, everything is intuitively clear.
2) in the form of a table in the sub-window of the indicator in the main chart window
green - strong positive correlation, coefficient of correlation >=0.8;
light green - positive correlation, coefficient of correlation >=0.6, but <0.8;
red - strong negative correlation, coefficient >=-0.8;
orange - negative, coefficient >=-0.6, but <-0.8;
I would like to hear your opinions on the improvement, the accuracy, the presentability of these indicators. What can be added or removed? I will be very grateful!
The value of the correlation depends on the calculation period, and it may vary significantly with increasing/decreasing of the period.
The correlation value depends on the calculation period, and it can change a lot when the period is increased/decreased.
Yes, I have prescribed this. the settings specify the bars from which period to take. Number of elements to calculate too - correlation can be calculated on any number of elements: 1, 2, 5, 10, 20, 32, 47 etc.
Yes, I prescribed that. The settings specify the bars from which period to take. The number of elements to calculate too - the correlation can be calculated by any number of elements: 1, 2, 5, 10, 20, 32, 47 etc.
The keyword is "correlation may or may not be calculated".
Which value is to be believed? How to apply it to trade, and not just trade, but profit from it. We don't write something to write it, but to profit from it.
The key word is "correlation may or may not be calculated".
Which value is to be believed? How to apply it to trading, and not just trading, but profiting from it. We don't write something to write it, but to profit from it.
Of course, I am not arguing with that. Surely, there are traders who use correlation, and the number of bars they take into account is their own system that they decide on their own.
I would like to hear your opinions on the improvement, the neatness, the presentability of these indicators. What can be added or, on the contrary, removed? I will be very grateful to you!
Bet on the calculation speed, so that you can use the indicator in the tester optimizer, including, for example, the input m = 10 000.
bet on the calculation speed, so that the indicator can be used in the tester optimiser, including, for example, the input m = 10 000.
by the way, yes. when i turn on the terminal, if the indicator is installed on the chart - the terminal hangs a bit, and also if i change the parameters from currencies to stocks in the table. what could be the solution?
By the way, yes. when I turn on the terminal, if the indicator is set on the chart - the terminal hangs a bit, and also if I change the parameters in the table from currencies to stocks. what could be the solution?
Try searching for it.
From a practical point of view, forward or reverse correlation, which does not change like the oscillator, but remains relatively constant, is useful for trading. This means that 24 candles for calculation is not enough. You need to find a value where the chart is much smoother. And we suppose that in this case calculation will strongly hamper the terminal. Then we can simplify it: do not display the whole table, but print only the part where the coefficient is close to 1 or -1, because other values are of little use.
Take away the correlation, add a multiplication table - it will be more useful for traders
Do you even understand the point of what you are doing? i.e. why?
Take away the correlation, add a multiplication table - it will be more useful for traders
Do you even understand the point of what you are doing? i.e. why?
- Free trading apps
- Over 8,000 signals for copying
- Economic news for exploring financial markets
You agree to website policy and terms of use
My friends, I would like your opinion. I have written the indicator of correlation according to Pearson in the form of the line between two pairs and in the form of a table of currency pairs, stocks and indices.
1) as a line
m=24 - number of bars for calculating the correlation between pairs
period=D1 - daily chart
price=close - closing prices;
bar=0 - 24 bars by close prices beginning from zero.
In principle, everything is intuitively clear.
2) in the form of a table in the sub-window of the indicator in the main chart window
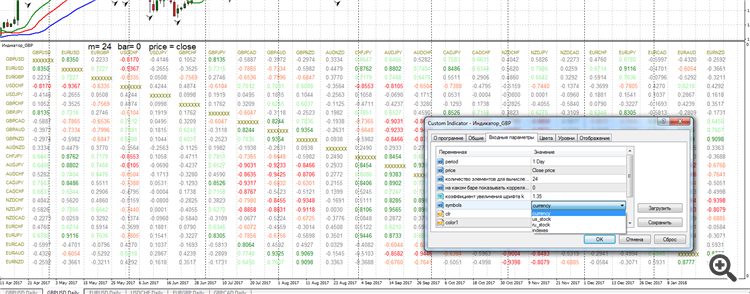
green - strong positive correlation, coefficient of correlation >=0.8;
light green - positive correlation, coefficient of correlation >=0.6, but <0.8;
red - strong negative correlation, coefficient >=-0.8;
orange - negative, coefficient >=-0.6, but <-0.8;
I would like to hear your opinions on the improvement, the neatness, the presentability, the design of these indicators. What can be added or removed? I will be very grateful!