From theory to practice - page 362
You are missing trading opportunities:
- Free trading apps
- Over 8,000 signals for copying
- Economic news for exploring financial markets
Registration
Log in
You agree to website policy and terms of use
If you do not have an account, please register
In fact, EVERYONE knows what to do with the normal distribution. Absolutely everyone, except the smartest chosen children, who should be in kindergarten colouring in white noise with crayons.
You're bad-mouthing a coin, but it's the benchmark of a Markovian process, with perfect unprofitability), which is written about in all decent textbooks).
Knowing such elementary things saves a lot of fruitless experiments)
(excuse me for yapping at the Godhead again.)
In fact, EVERYONE knows what to do with the normal distribution. Absolutely everyone, except the smartest chosen children, who should be in kindergarten painting white noise with crayons.
And it's true, so many interesting people have left the forum, if you read the whole thread first, curious things were discussed.
No. Exactly the conversion to a Markovian or semi-Markovian process. I'll write on this subject in two weeks. With graphs, calculations. So far it's all on the level of hypotheses, and we need facts.
I am extremely surprised. If we need exactly Markov processes ticks are not necessary, exactly within one or two spreads DTs spoil the Markov picture with their deterministic filters. Alexander, read my notes of five years ago. I won't correct it, I'll only comment at the end.
For forex with a constant reminder that past successes do not guarantee anything in the future, it is natural
to check this statement in this form: for any x and y, as a result of a rate movement from K first by x, then by y,
the expected movement from the new point K+x+y is the same.
My solution of the functional equation F (x + y) = F (x) * F (y) for bounded x > 0, y > 0 (1)
F (x + y) is the probability of a y-point pullback after x + y has passed from the origin. It is a typical event for
martingale. The martingale starts at x rate, then after leaving it at a loss till x - y the stake is doubled, till x - 2y
doubles again and so on. The loss disappears on a pullback from x - n * y to x - (n - 1) * y,
this is the Breakeven level. At the start the number of lot doubles is n = 0.
Equality (1) is obtained empirically in the analysis of the course by its extremums. And, in particular, statistically describes
the given martingale.
Denote y = x + dx and take small dx, (1) <=> F (x + dx) = F (x) * F (dx) (2)
With F (0) = 1, rolling back by y points will inevitably happen. Let's subtract F(x) on the left and on the right in (2):
F (x + dx) - F (x) = F (x) * (F (dx) - 1) (3)
and divide (3) by F (x) * dx:
F (x + dx) - F (x)
------------------ = (F (dx) - 1) / dx (4)
F (x) * dx
Dividing requires F (x) > 0, which, generally speaking, may not happen. For example, in share trading it happens
For example, in the case of a sell ban when the exchange rate is prevented from declining. The CNY is also sometimes subject to a restriction, even
a "parallel" currency CNH with milder restrictions. We will consider such cases as exotic and consider
a variant when F (x) behaves "decently" in the exchange rate area we are interested in, i.e. it is continuous along with the first
derivative of x. Let F(dx) in the neighborhood of zero be represented by a segment of a Taylor series, discarding the terms with the second derivative
and above, then the right hand side of (4) becomes
(F (dx) - 1) / dx = (F (0) + dx * F'(0) - 1) / dx = F'(0),
and on the left-hand side of (4), going to the limit at x -> 0, we obtain the derivative of the logarithm ln F(x). Then
[ln F(x)]' = F' (0) (5)
Denote the value of the first derivative F(x) at zero F'(0) by a constant -a^2 (the probability decreases with x) and
let us reintegrate equality (5):
ln F(x) = -a^2 * x, or F (x) = exp (-a^2 * x) (6)
This solution can also be written in the form F (x) = b^x by putting b = exp (-a^2). The interesting thing is that it turns out that a = 1 and
F (x) = exp (-x) (7)
For the forex instruments I have investigated.
Today's comment: we are actually talking about a no-rebound trend. It actually looks like a special zigzag. And the average (expectation) for F (x) = exp (-x) is exactly 1 as for these zigzags exponent exp (-k) decreases by kx points of those steps that have already exceeded x points. Start with 5 4 digits, I think you can't go wrong
Vladimir!!!! I remember my promise and will keep it. I am ashamed to offer you what I have now. Not that, although it is profitable.
Yes, and I will study your post, of course.
In fact, EVERYONE knows what to do with a normal distribution.
Well, here's a graph of a coin.
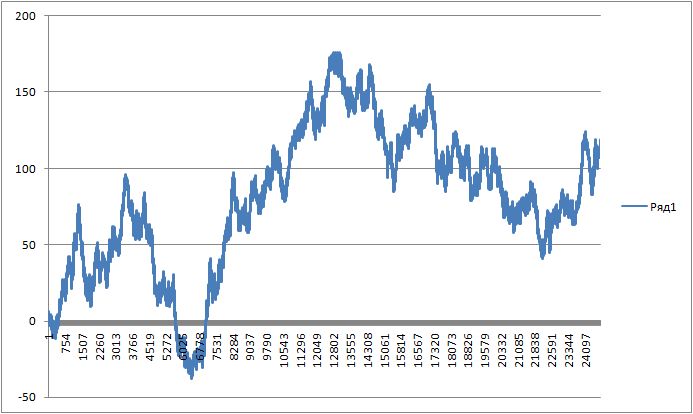
Here's his normal distribution.
What do you do with it?
(taken in packs of 100 outcomes)
igrok333:
well here's a graph of the coin
here's its normal distribution
what are you going to do with it?
(we took a pack of 100.)
At the bottom is the distribution of the increments? With exponential correlation fukn it's an Ornstein-Uhlenbeck process with a return to the mean. Build a channel around the waving and that's it. The sliding window of observations has to be calculated.
To be honest I am always amazed by clowns who try to outsmart the market through high frequency trading, martingale, statists chasing the proverbial distribution.
The thing is that all possible commissions, spreads, filters that include brokerage companies on their side is all there is to protect brokerage companies from such clowns that think they can outplay everyone in the market, but for some reason they try to pick pocket of brokerage companies. That is, they try to cheat their broker, not to take money from the market. But the sad thing is that they cheat only themselves.
By introducing these conditions for trading they not only want to make money, but also to protect themselves from the rogues who think they are smarter than others. That's why brokerage companies don't pay to such people...
I always start smiling involuntarily when I see descriptions of super-duper indicators customizing for a particular symbol or TF..... Are you people WAKE UP!!!!!
If you really have a good TS which takes money from the market and not trying to cheat brokerage companies, it should work for ANY symbol (from the stock to bitcoin) and any TF. IMHO!!!!
When I say TC I mean a method or an approach to the market. If it is a marketable, adequate TS will be robust on any symbol and any timeframe!!!!
Question for those who are smart.
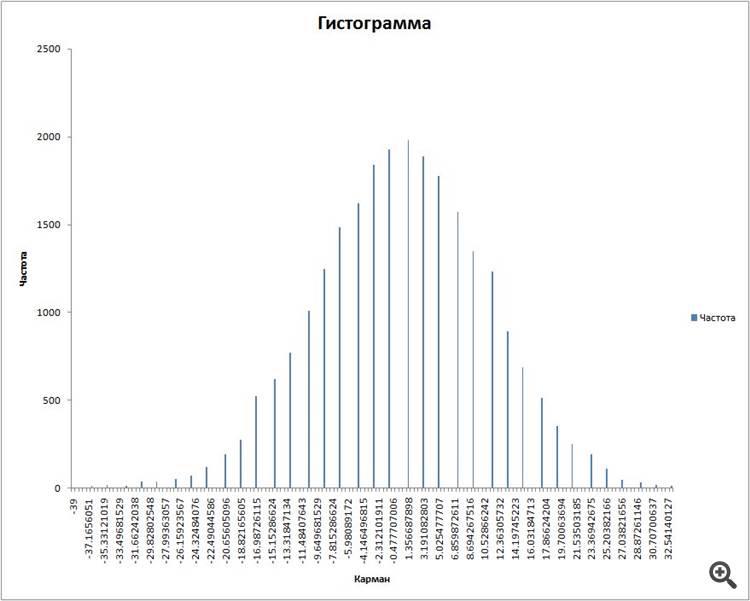
I plotted a coin. I took packs of 100 outcomes and a sliding window, plotted a histogram of distributions for them.
Then I plotted the normal distribution using the formula:
for the known expectation and standard deviation.
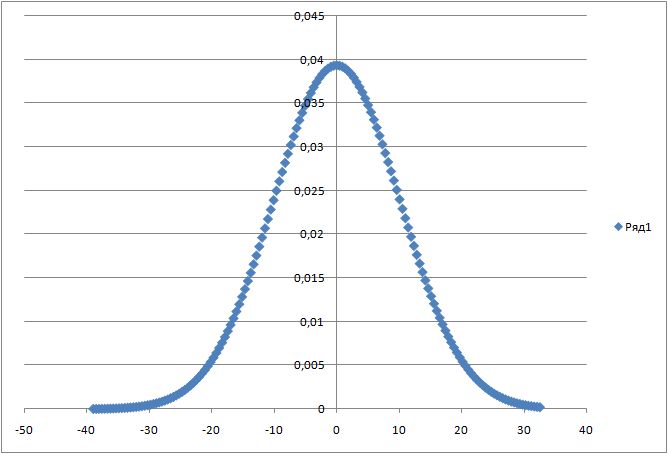
the link
I got this:
Question: how to combine these two graphs in one picture? Because when calculating the histogram of distributions, Exel calculates everything in frequency and the histogram peak is set to the value of 2000.
And when calculating the formula, it counts in numbers, and the peak is 0.04.