From theory to practice - page 179
You are missing trading opportunities:
- Free trading apps
- Over 8,000 signals for copying
- Economic news for exploring financial markets
Registration
Log in
You agree to website policy and terms of use
If you do not have an account, please register
Thanks for the links, of course. But, you don't understand - these archives still need to be converted! As if the ticks come every 1 or 5 or 10 seconds! I stand by my opinion - it is in a different number of ticks for a certain interval of time the main difficulty of this task.
Is it difficult to switch from ticks to any time interval? In the terminal all standard timeframes are generated from ticks all the time, and for all instruments simultaneously, and nothing... And it's been like that for 15 years, no one thought it was or seems complicated. There is no such thing as complexity here. Trying to bolt a probabilistic apparatus to a process that has no statistical stability is, yes, objectively difficult. Not to say "frivolous".
I was reminded of another consideration in figuring out the necessary frequency of the required data. Your trading from the edge of deviation to the moving average, on trades already shown, is characterised by time periods like an hour. This is not scalping at all, where ticks are needed. In order not to miss important data, you cannot read them less frequently than Kotelnikov's theorem dictates. Seems so (this area is far from me and I could be wrong)?
So what frequency of receiving quotes does this theorem require in your case? My feeling is that fifteen minutes would be enough for you... You haven't counted?
Make plans to make money on forex, you can. Only there is always a greater chance of making fun of God). It would be better not to give information to relatives. Then you wouldn't have to make excuses in case you fail. And if you do, it would be a pleasant surprise for them.
That's a good point.
As of this week, the trading intensity is included in the calculations (see bottom right graph)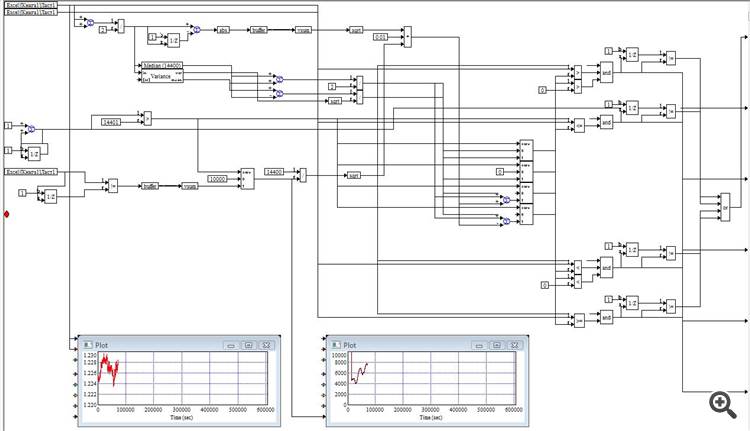
This has greatly increased the accuracy of the variance calculation.
I need to make sure that the intensity forms a Poisson distribution. If it does - I will start distributing the model immediately.
From this week, the trading intensity is included in the calculations (see bottom right graph)
This has greatly increased the accuracy of the variance calculation.
I need to make sure that the intensity forms a Poisson distribution. If it does, I will start distributing the model immediately.
I need to make sure that the intensity forms a Poisson distribution. If it does, I'll start handing out the model immediately.
My daughter and father-in-law won't survive it.
In fact, I also want such a toy for myself - VisSim, or whatever it's called now.
Is that the number of ticks per interval or what?
That's right. Per sliding observation window = 4 hours
That's right. Per sliding observation window = 4 hours
***
For my part I would like to add a bit of theory (sorry if it's a bit off-topic, I don't mean it as a joke, just something to think about...):
right from the author after the article:
https://www.mql5.com/ru/articles/446
right after the article (you don't have to read it) with point 1...
point 4 You can also liken the automatic control systemto a Rectifier:
п.8
8. Функция Вейерштрасса https://ru.wikipedia.org/wiki/%D0%A4%D1%83%D0%BD%D0%BA%D1%86%D0%B8%D1%8F_%D0%92%D0%B5%D0%B9%D0%B5%D1%80%D1%88%D1%82%D1%80%D0%B0%D1%81%D1%81%D0%B0
Everyone studies the chart, everyone knows that it is fractal, but its main feature is that the price chart is a stochasticWeierstrass Function. A fractal function! Continuous everywhere, but nowhere has a derivative!
This is especially frightening:
The Weierstrass function is an example of a continuous function with no derivative anywhere;a counterexample tothe Ampere hypothesis.
---
But after p.8, I feel a little afraid... if it is so, the grail is far away... :-)
Today's trade is slightly worse than yesterday's:
+238 pips in total.
In 2 days there were 2 trades (+2/-0) +778 pips.
Today's trade is slightly worse than yesterday's:
+238 pips in total.
In 2 days there were 2 trades (+2/-0) +778 pips.
To put it bluntly, the trade is nothing, though profitable in the end. You have overshot the drawdown equal to the profit.
A normal system would have closed the deal by a stop loss. A normal system would never open such a deal - there is nothing on the chart that will change the direction of the price, and it, the price went further down. That is, there are no entry criteria other than price moving out of a certain range.