From theory to practice - page 173
You are missing trading opportunities:
- Free trading apps
- Over 8,000 signals for copying
- Economic news for exploring financial markets
Registration
Log in
You agree to website policy and terms of use
If you do not have an account, please register
Greetings, Vladimir!
There are no his works on quantum physics on the Internet - I have searched everything. There is only junk left, written in his old age. I really want to understand how he came to this pseudo-differential equation... You won't believe it - his analytical conclusions fully correspond to my experimental data.
In https://www.mql5.com/ru/forum/221552/page158#comment_6392311 I gave you the link.
It contains the parameter (Overshot), MQL programs that calculate it, ways to apply it and interpret the results - in general, all the things that nonentropy does not have. And, most importantly, a direct proof of the separation of the trend from the flat. Unlike non-entropy, in the necessary properties of which we are so far convinced by your traditional "So-and-so", the price for which has already been clarified here by numerous examples of your conviction, certainty. Including absolute ones.
Put a monument to the authors of that message (article).
The trend from the flat is nicely separated by the usual high/low update, if anything (very close in meaning to the overshots that Vladimir writes about. True, the zigzag has a fixed threshold, and I don't really like it).
I would like to clarify.
I think it is interesting to see the effect of the nature of the fluctuations on the profitability of trading on level breakout and on level rebound. Hence the trend/float division and its purpose. In http://www.argolab.net/izuchaem-zigzagi.html this objective is reflected directly:
"If in practice the mean value of overshots is much larger than 1, it means we are profitable to open a trade to the direction of a formed ZigZag knee ("to breakout"). And if it is significantly less than 1, then we should open a deal in the opposite direction ("on reversal")".
I don't yet understand how this goal is reflected in the "normal hai/loi update". Would you tell me?
It is just a tool, like the zigzag, for example: High(i, 30)-High(i+5, 30). It's just closer to me because it (probably) takes into account the current volatility better. Like in the zigzag, it is possible to invent some metrics, for example, to divide the update value by the height (width?) of the channel. On a flat it will be close to zero, on a trend it will be 0.5-1. Where the zigzag has an overshot, this instrument will have a high/low update.
As for the nature of fluctuations, averaging the metrics over the whole asset is kind of like "average hospital temperature", because trendiness/flatness is concentrated in certain hours of the day (if we are talking about intraday work). Although there are two crosses (I think you know which ones) that have, on average, slightly higher flatness than other pairs.
Talking about the parameter which can be used to distinguish between a flat and a trend.
This parameter is not Hearst's coefficient.
You know what? This parameter is called the non-entropy https://en.wikipedia.org/wiki/Negentropy.
The first one who will learn to correctly calculate it and use in algorithms, he should receive a monument in his lifetime from the grateful humanity. That's it!
another attempt at smoothing
It can be done that way
But there's just one problem.
again, it loses accuracy.
And "a penny a penny saves a penny".
another attempt at smoothing out
That's fine.
but there's just one problem.
Once again, accuracy is lost.
and "a penny saved a penny."
No, it's a cool thing. In fact, it is the sum of the products of incremental probabilities and the logarithms of those probabilities for a given sample size. It shows how much the probability distribution at a given point in time differs from some benchmark. You just have to make a table, like Hurst, and that's it.
I have been looking for this hidden parameter for a long time, as asymmetry and kurtosis are not enough. I tearfully asked traders here on the forum to help me find it. Only 2 traders I respect - Vladimir and Dmitriy Skub - responded to this request. They both suggested their variants. I have not understood anything and do not understand anything. How come that people earn money here without knowing a thing? It is a paradox!
Here are the charts for AUDCAD over the past 2 weeks with a sample size of 16900 ticks for exponential readout time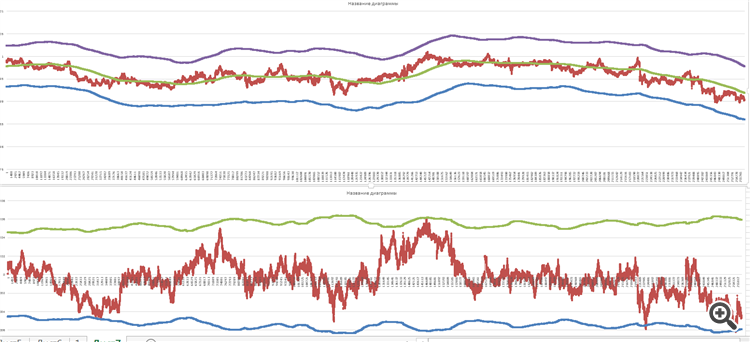
Yes, everything seems fine and good, but something is bothering me... Let me explain what.
First, a bit of theory:
This product F(x,t) is the distribution of increments that we see.
MacDonald's function is responsible for the "memory" of our process.
And here's what I get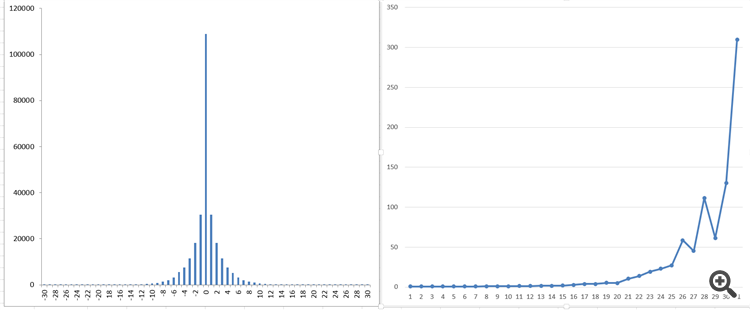
What you see on the right is what I get as a process "memory".
This is with a general population of over 250,000 ticks!
Alas, I don't see a smooth function like the modified Bessel functions. There shouldn't be these "jumps"...
This is the reason why I've almost come to the conclusion that I'm probably taking the tick data the wrong way after all.
I still need to take it at regular intervals. Although... Only practice can confirm it.
So far I'm left with a good result and unbridled doubts...
And this is what I get.
What you see on the right is what I get as a process "memory".
This is with a general population of over 250,000 ticks!
Alas, I don't see a smooth function like the modified Bessel functions. There shouldn't be these "jumps"...
This is the reason why I've almost come to the conclusion that I'm probably taking the tick data the wrong way after all.
I still need to take it at regular intervals. Although... Only practice can confirm it.
So far I am left with a good result and unrestrained doubts...
Your data is correct - everyone has it, and on all timeframes. It's the usual kind of unsteady increments with a full bouquet: mean changes, variance changes, tails and ARCH effect. You have to model everything:
And thousands and thousands of people have been doing this for 30 or 40 years.