From theory to practice - page 1164
You are missing trading opportunities:
- Free trading apps
- Over 8,000 signals for copying
- Economic news for exploring financial markets
Registration
Log in
You agree to website policy and terms of use
If you do not have an account, please register
... Kotelnikov doesn't fit?
Kotelnikov's theorem does not fit because of: 1) the non-stationarity of the price, 2) its discontinuities, 3) the apparent unboundedness of its spectrum (if we ignore the previous points). Of course, this does not make sense (mathematically) to the utterances of our grapheme. Trader's sense in his excerpts is obviously quite possible, but only if one is lucky with the market behaviour.
On different inputs, yes. I'm aiming for the TS at any broker to work the same way. This requires synchronisation of threads between the different DCs.
I take the ticks as follows:
1. Every N seconds I get a quote.
2. I look if Bid, Ask or server time of this quote has changed.
If any of these parameters has changed - the quote is real (i.e. we have an event) and it is used in calculations, if not - it isn't.
At the end of the week I compare my set of events with quotes from Dukas.
Now I have desynchronisation due to strange dips at certain frequencies.
If there is inaccuracy in data reception/processing, then the error in process variance calculation is obvious.
Are you picking tick numbers out of the lognormal spread? i.e. pseudo-randomly, or did I miss something, learning the art of warfare with MO algorithms
if yes, then the ts will behave differently depending on the time of activation, or there's some evidence that they converge
If I understood correctly, it is about the distribution of events (candlestick size or tick) on the x-axis (time).
no...
first it is necessary to find the pattern in the market, as I said based on 98% randomness and 2% non-randomness on average
further to see that this regularity and the degree of its working out depends directly on time, the time that somehow characterizes the current wave (if we can call it that way) process. For example, on EURUSD this time is at least 15 minutes and may last for 2-3 days...or even a week.
I haven't quite figured out how to do it so far, but I am pretty sure it works.
There is one way that is potentially effective and simple I will try it out.What an imbecile child :))) Your posts should be plastered over toilets.
I think you should take a Novopassit - you get too excited after a few plus trades)).
You can't do that with real money...
You select tick numbers from lognormal distribution, right? i.e. pseudo-randomly, or did I miss something, learning the art of warfare with MO algorithms
If yes, then the ts will behave differently depending on the time of activation, or there's some evidence that they converge
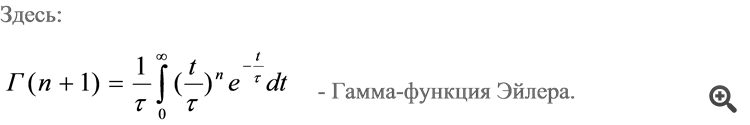
No. The events (streams of quotes synchronised between different DCs) themselves form a gamma distribution in time.
I use this feature when calculating process variance.
In formulas for calculating the diffusion (dispersion) of stochastic processes there is always either T - time (via uniform discretization) or N - number of steps of a wandering particle (no time at all).
I have introduced in these calculations function T(N) and now just look at results in practice.
If you need the Grail before without taking into account the changing times of the market's defining movements, you can't do without it. Time directly affects the accuracy of trades.
If it helps, you can use this representation of the concept M - "Present time", which is non-linear:
However, this concept is hardly applicable to ticks, because time or duration of t is an instant, before it is the past and after it is the future. A second or a minute has a duration of t, but ticks do not.No. The events (streams of quotes synchronised between different DCs) themselves form a gamma distribution in time.
I use this feature when calculating process variance.
In formulas for calculating the diffusion (dispersion) of stochastic processes there is always either T - time (via uniform discretization) or N - number of steps of a wandering particle (no time at all).
I have introduced in these calculations function T(N) and now just look at results in practice.
Does VimSim work with SQL databases?
No.
what do you need the time for?
You only need time to synchronise currency pairs, no more
If the strategy does not imply portfolio analysis, i.e. every currency pair is traded according to a self-sufficient algorithm, then there is no need to take time into account.what do you need the time for?
You only need time to synchronize currency pairs, no more.
If the strategy does not involve portfolio analysis, i.e. each currency pair is traded according to a self-sufficient algorithm, then there is no need to take time into account.And not only. Also for synchronization of quotes flow between different brokerage companies.
And this time is not evenly discretized, since it is only valid for continuous functions (signals).
Time on the market has a mysterious, psychedelic sense and action. In it sits the Grail.