Machine learning in trading: theory, models, practice and algo-trading - page 1756
You are missing trading opportunities:
- Free trading apps
- Over 8,000 signals for copying
- Economic news for exploring financial markets
Registration
Log in
You agree to website policy and terms of use
If you do not have an account, please register
I understand that, but it is for one averaging, or rather thinning, the question is how to make the same algorithm for all TFs
This is quite a complicated question, I'm constantly thinking about it myself, I will only say that the right direction is spectral analysis
How to make a decision that instead of a 5-minute timeframe the target is 15 minutes, and then we look at the hourly, and then the hourly ended and we went back to the minute
I think the right answer is a simulation, nobody knows how to do it right, so you need to simulate all the actions and get the result statistics
Also you have to have adaptivity, depending on the market characteristics you have to change the decision making parameters
Targeted action is what we assume people, executors or friends should and will do when we do something together. But sometimes you say one thing, but they do not understand you in the way you expect. In one-sentence tasks, this is easy to fix. In complex ones it is harder.
This is quite a complicated question, I think about it all the time myself, I will only say that the right direction is spectral analysis
I think the right answer here is simulation, nobody knows how to do it right, so you have to simulate all the actions and get the resultant statistics
Spectral analysis does not hurt, but it plays where the spectral essence, molecules and atoms oscillate with a certain frequency, emit a certain wave frequency and here the spectrograph works. In the community of people, wave theories have a place, so spectral analysis is appropriate, but in the community of people there are no wave spectral entities, so you can't describe the system completely with waves. This is just a hypothesis, though.
I don't get the simulation part. We have a history from '70 on each instrument. This is what is in the asset and what we can work with.
Spectral analysis is fine, but it plays where a spectral entity, molecules and atoms oscillate with a certain frequency, emit a certain frequency of waves and here the spectrograph works. In the human community, wave theories have a place, so spectral analysis is appropriate, but in the human community there are no wave spectral entities, so you can't fully describe the system with waves. This is just a hypothesis, though.
I don't get the simulation part. We have a history from '70 on each instrument. This is what we have in our assets and what we can work with.
You simulate your actions with a machine...
If I buy after the daily high at 5 min, I see a divergence on m60, what if I buy after the daily high?
This is how you simulate trading on history... And then deep rules of decision-making are generated ...
I think the algorithm is simple, look at the zigzag of each timeframe and average the trends value and time of trends. We see where the value of trends is 2 times the spread, it means we can work in this timeframe. We also look at the speed, i.e. the average value of trends divided by the average duration and find the highest value. But that's not the case.... as it's fucking easy.
Not simple, but rather primitive, and you are always in the lag, it's like trading a mashka
Spectral analysis
was invented about 100 years ago.)
It may come in handy:
Thecode base has indicators that calculate the trigonometric phase (in degrees) of the intended wave.MT4,MT5.
It's easier to move a digitized sine wave (to adjust the phase).
But there are no wave spectral entities in the human community,
Of course there are.
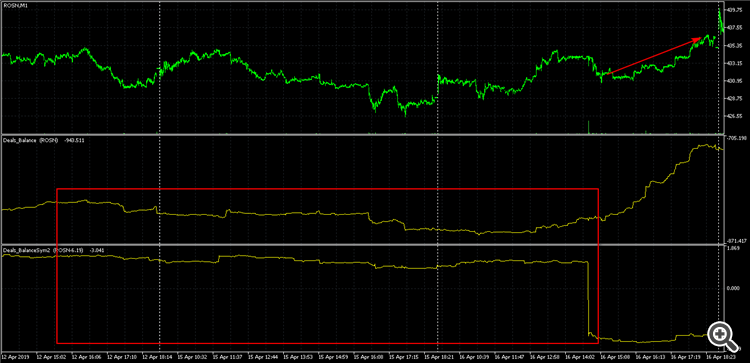
If not to fixate on ForEx... Russian exchanges (MOEX, FORTS), for example, give more information on quotes. This is the ratio of the volume of open positions, a table of all transactions. A year ago I was addicted to "all my trades". I made an indicator that shows all deals as a cumulative balance. . It allowed me to observe interesting things:
You can often see significant discrepancies between price increments and balance increments for all trades (which is not supposed to be logical). You can observe when there are significant volume downloads at a flattening price. Next comes the payoff for greed! Since the closing of Buy positions is performed by Sell deals, in fact, it does not prevent visualization. The important thing here is the preponderance of the Open Interest. I mean that such additional information on the entry of NS would not prevent it. :)