Machine learning in trading: theory, models, practice and algo-trading - page 1459
You are missing trading opportunities:
- Free trading apps
- Over 8,000 signals for copying
- Economic news for exploring financial markets
Registration
Log in
You agree to website policy and terms of use
If you do not have an account, please register
Did you understand what you said? That's not what it's about at all. Once again, for the especially stupid:
Complete nonsense, at the level of a Neanderthal - repeats that he does not understand.Are you a d? It says the same thing.
The question about d... rhetorical
Teacher, why don't you go to the nuthouse?)
You're a f...
About market volatility...
I'm trying to train les to trade with fixed TP/SL.
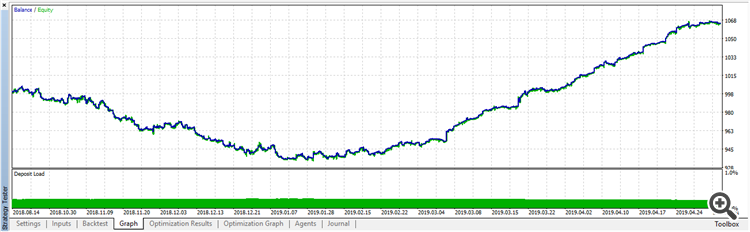
Saw an interesting backtest (i.e. fitting to the story)
Before Jan 17, 2017 the set TP=120 and SL=80 were making good profits and after that they stopped working. Apparently the amplitude of price movements has changed, e.g. stopped reaching 120 pts from similar points in 2016. The forwards turned out about the same as all of 2017, i.e. 50/50.
Most probably it retrained on noise with a loss of the trend component.
If they retrain on trends, then the equity is vice versa
I don't understand what it is connected with, it is always different (if I re-learn without control).
Here is the second type of retraining (for the trend). Re-trained in the right and in the wrong direction (same model)
From 2019.03 training.
You know the easiest way to teach? You build a trend on the days, for example. You look for a normal linear or polynomial plot, train half of it, and the other half should be just as good. As long as the trend persists (you check for deviations from the trend), you continue to trade with the bot.most likely retrained on noise, with a loss of the trend component
If they retrain on trends, then the equity is reversed mirrorwise
i also get that sometimes, i have not understood the reason, it is always different (if i have retrained without control)
Here is the second type of retraining (for the trend). Re-trained in the right and in the wrong direction (same model)
From 2019.03 training.
You know the easiest way to teach? You build a trend on the days, for example. You look for a normal linear or polynomial plot, train half of it, and the other half should be just as good. As long as the trend persists (you check for deviations from the trend), you continue trading with the bot.I'm digging the other way.
I don't build trends, I have training with a teacher, each bar is marked whether the TP or SL is reached. I cannot make trends or flat - let the woods sort it out.
In my case, you can clearly see that after 17.01.2017 the TP is reached less frequently or the SL is reached more often.
I'm digging in a different direction.
I do not build trends, I have training with the teacher, each bar is marked whether it reaches the TP or SL. Trends or flat - let the forest figure it out for itself.
In my case, you can clearly see that after 17.01.2017 the TP has been reached less often or the SL has been reached more often.
I don't know how the forest will work it out on its own, it's not much of an honor.
Either there is a feature that is responsible for the trend or there isn'thow the forest will sort itself out, is not too much of an honor
Either there is a chip responsible for the trend or there isn't.A dozen bars from different TFs carry such information.
I don't think so.
I don't think so.
In general, the forest will simply remember the patterns of these 10 bars and in a close situation will act the same way.
It's a pity that it will remember the noise, too.
Well in general the forest will simply remember the patterns from these 10 bars and will act similarly in a close situation.
No, it doesn't work that way. It will turn out like Yusuf's (i.e., as usual). Econometrics developed types for a reason, nobody remembers anything from such small samples.
Trends and other components are highlighted. After that, nonlinearities remain, which are fed by the NS. I.e. it is a multilayer pie (2-layer at least)
What all sorts of asaiulenks and others trash-talk - that's just pathetic people, who haven't even read a bookNo, it doesn't work that way. It will turn out like Yusuf's (i.e., as usual). Econometrics developed types for a reason, nobody remembers anything from such small samples.
Trends and other components are highlighted. After that, nonlinearities remain, which are fed by the NS. So it is a multilayer pie (2-layer at least).
In general, of course it is necessary to try different indices to the forest and observe the result. Maybe I will get to trend indices in time. I also tried Zigzag, but did not get 32% like Alexey did ( Probably he has some kind of special ZZ, or maybe he peeks.