Recurring horizontal levels
Hi
These days I have discovered the Murrey Math indicator (very good, by the way).
Is there an indicator that does this?
Hello .
The mechanism described is utilized in "Market/Volume Profiles" type indicators .(the mechanism not the solution you seek)
How do you want to apply it in these horizontal lines ?
- Is there an importance threshold for displaying a line ?
- Does it apply to the line or zones in general ?
- What is the range for evaluating line importance ,the latest day ,month ,all data ?
Hi .
The described mechanism is used in "Market / Volume Profiles" type indicators (the mechanism is not the solution you are looking for)
How do you want to apply it on these horizontal lines ?
- Is there a significance threshold for displaying a line?
- Does it apply to the line or zones in general?
- What is the range to evaluate the importance of the line, the last day, month, all the data?
Thanks for your prompt response!
- The range of importance is 3 lines above and 3 lines below Ask, at a distance of 1500 to 3500 points.
- It applies to the line.
- The range to evaluate is the last 6 months.
Thanks for your prompt response!
- The range of importance is 3 lines above and 3 lines below Ask, at a distance of 1500 to 3500 points.
- It applies to the line.
- The range to evaluate is the last 6 months.
(im actually not Spanish despite of the sexy name)
Hmm , thats actually interesting .
So :
Are the lines existing as objects in your code ?
- Are you managing and updating them according to "3 lines above and 3 lines below"?
- If 6 months is not available ? [its not as important though because the same range from which importance is derrived off of is common for all 6 lines ,so an indication could be present in chart]
(in reality I am not Spanish in the name of sexy)
hahaha
Hmm , thats actually interesting .
So :
Are the lines existing as objects in your code ?
- Are you managing and updating them according to "3 lines above and 3 lines below"?
- If 6 months is not available ? [its not as important though because the same range from which importance is derrived off of is common for all 6 lines ,so an indication could be present in chart]
Yes, the lines are objects on the chart, they are created after the price has touched or crossed them with recurrence.
- Yes, they update when the price changes. The important thing is that there is this recurrence of touch or crossing of the candle.
- I think 6 months will be available, I only trade on D1 with major pairs.
Heres a version with pivot points .
You can adjust it to Your indicator .
That was a fun dev . Enjoy
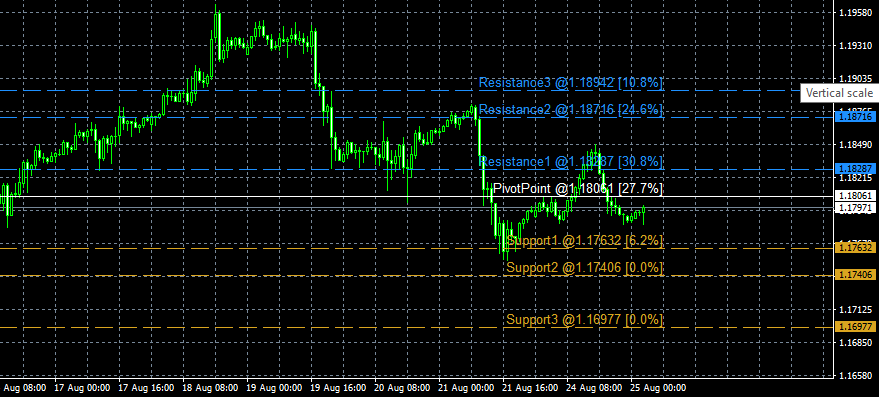
Heres a version with pivot points .
You can adjust it to Your indicator .
That was a fun dev . Enjoy
Let me understand what you did:
You calculated the traditional Pivot Points, and evaluated the importance of each line with respect to the number of candles and wicks that they touch. Is that so?
I attach a graph of what I do manually, so that you realize that it is similar but not the same.
Basically it is the number of candles that touch the line that gives the level, at a maximum distance (according to my visual assessment) of 3,500 points from the current price.

The more candles / wicks that line touches, the more important the level becomes.
However, I can tell you that you have greatly improved the Pivot Points indicator, which is worth using.
Thank you .
What i did is a bit of an "overkill"
What you actually need is the functions in the file "LevelImportanceNativeChart.mqh" - i also forgot to include the volume calcuation in there -
I assume you dont want to make the "importance" relative to the other levels ,you just want "points" for every candle pierced .So
Here is a simple example
#property strict
#include <LorioTools\LevelImportanceNativeChart.mqh>
int OnInit()
  {
//--- create timer
  //you will do this for all your lines
  double line_price=High[1];//put your price in here
  int old_bar=600;//the bar that checks will start from : if it exceeds chart bars it will be limited automatically
  int new_bar=0;  //the bar that checks end to          :
  //What checks ? the calculations for the line importance
  //What is line importance ? how many candles your line "pierces" through
  /*
  so by knowing a line will "pierce" the same candle only in one point ,we can
  assign the same importance "weight" to wicks and body of the candle
  and disable the volume weights and the following importance
  [the following importance reaction is if a bull bar hits a line and then the market drops ,that adds to the importance of a line,
   and the opposite if there is no reaction to that level]
  [previous importance 0 for now ,if you want to measure change of importance in a line that is constant across time then
  you can send each previous importance score there .you dont need it for now so 0]
  */
  //so declare our return vessel : Wicks count true , importance of wicks 1 Bodies count true ,importance of bodies 1
  level_results results=FindLevelImportance(line_price,0,old_bar,new_bar,false,true,1,true,1,false,0);
  if(results.completed)
    {
    Print("Line importance : "+DoubleToString(results.importance,Digits()));
    /*
      you will notice that the importance is in points
      it was built so to accomodate the reaction bar measurement
      but ,having set wick and body importance to 1 (equal) we
      can just divide the result with the point() and get how many candles
      the level pierced.
    */
    int candles=(int)(results.importance/Point());
    Print("Line cuts "+IntegerToString(candles)+" bars");
    Print("tested From : "+TimeToString(results.from,TIME_DATE|TIME_MINUTES|TIME_SECONDS));
    Print("tested upto : "+TimeToString(results.to,TIME_DATE|TIME_MINUTES|TIME_SECONDS));
    }
  if(!results.completed){Print("Could not calculate importance");}
//---
   return(INIT_SUCCEEDED);
  }
Thank you .
What I did was a bit "over the top"
What you really need are the functions in the file "LevelImportanceNativeChart.mqh" - I also forgot to include the volume calculation there -
I guess you don't want to make the "importance" relative to the other levels, you just want "points" for each pierced candle.
Here is a simple example
Ok, thank you very much, I will review it.
- Free trading apps
- Over 8,000 signals for copying
- Economic news for exploring financial markets
You agree to website policy and terms of use
Hi
These days I have discovered the Murrey Math indicator (very good, by the way).
Is there an indicator that does this?