Hi Nelodi
Thanks for your creative idea and lay out in coding form,real appreciations.
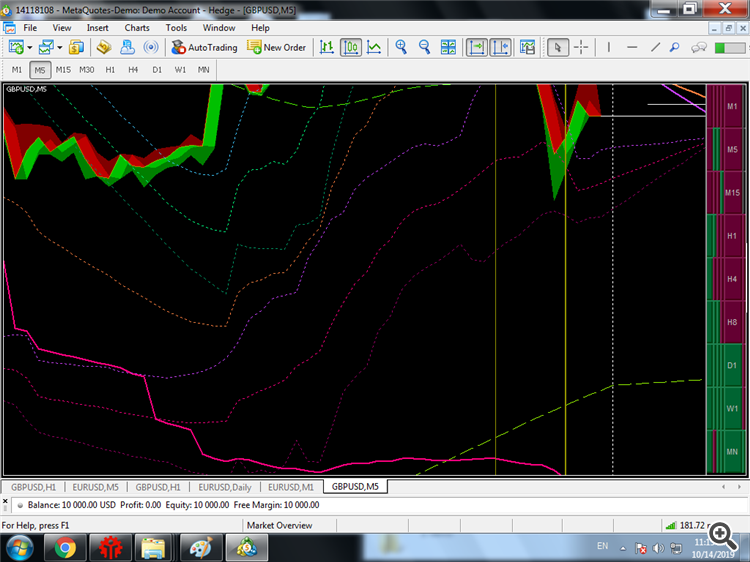
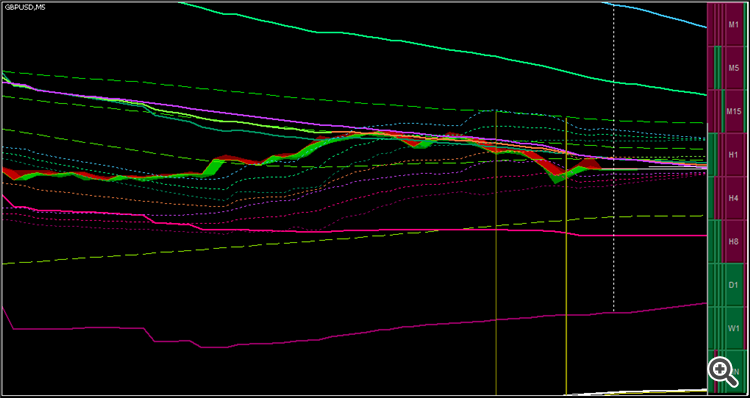
May i know,when i zoom in/out (vertically) for to best suit me it get back on default,can it is coded the way that a user can adjust it according to his suitability.
regards
Hi Nelodi
Thanks for your creative idea and lay out in coding form,real appreciations.
May i know,when i zoom in/out (vertically) for to best suit me it get back on default,can it is coded the way that a user can adjust it according to his suitability.
regards
If you open the "NLD_Main.mq5" file and look at the top of the "void ButtonsCreate()" method ...
void ButtonsCreate()
  {
   int id=ChartWindowFind();
   int xHig=(int)ChartGetInteger(ChartID(),CHART_HEIGHT_IN_PIXELS,id);
   iHig=xHig/9; // <- THIS LINE!
you will see that it calculates the "iHig" value, which is later used as height for buttons in pixels. If you want Button height to be fixed, simply remove that formula and set "iHig" to a fixed value in pixels.
If you are using fixed chart scale and do NOT want "NLD_Main" to change the min and max values of the chart, then you should find this block of code in the "NLD_Main.mq5" file ...
        if(ChartGetInteger(ChartID(),CHART_SCALEFIX))
           {
            int j=i+VisibleRange;
            if(j>=rates_total) j=rates_total-1;
            double cu=MathMax(ask,high[0]);
            double cd=MathMin(bid,low[0]);
            for (int k=i;k<=j;k++)
               {
               if(cu<ExtAVGBuffer[k]) cu=ExtAVGBuffer[k];
               if(cd>ExtAVGBuffer[k]) cd=ExtAVGBuffer[k];
               }
            ChartSetDouble(ChartID(),CHART_FIXED_MAX,MathMax(cu,MathMax(MathMax(h1,MathMax(u1,t1)),MathMax(h2,MathMax(u2,t2))))+comSpread+pixel*10);
            ChartSetDouble(ChartID(),CHART_FIXED_MIN,MathMin(cd,MathMin(MathMin(l1,MathMin(d1,b1)),MathMin(l2,MathMin(d2,b2))))-comSpread-pixel*10);
           }
... and either delete it, or change it to better suit your needs.
Btw ... I've just released a minor update now, where that code block changes to make all candles visible when using fixed scale, because I've found it annoying when high and low candles went out of scope. Anyway ... this is how the modified code block looks like (from the latest update) ...
         if(ChartGetInteger(ChartID(),CHART_SCALEFIX))
           {
            int j=i+VisibleRange; if(j>=rates_total) j=rates_total-1;
            double cu=ask;
            double cd=bid;
            for (int k=i;k<=j;k++)
               {
               if(cu<ExtAVGBuffer[k]) cu=ExtAVGBuffer[k];
               if(cd>ExtAVGBuffer[k]) cd=ExtAVGBuffer[k];
               }
            j=i+VisibleRange-ExtraRange; if(j>=rates_total) j=rates_total-1;
            for (int k=i-ExtraRange;k<=j;k++)
               {
               if(cu<high[k]) cu=high[k];
               if(cd>low[k]) cd=low[k];
               }
            ChartSetDouble(ChartID(),CHART_FIXED_MAX,MathMax(cu,MathMax(MathMax(h1,MathMax(u1,t1)),MathMax(h2,MathMax(u2,t2))))+comSpread+pixel*10);
            ChartSetDouble(ChartID(),CHART_FIXED_MIN,MathMin(cd,MathMin(MathMin(l1,MathMin(d1,b1)),MathMin(l2,MathMin(d2,b2))))-comSpread-pixel*10);
           }
If you are using fixed chart scale and do NOT want "NLD_Main" to change the min and max values of the chart, then you should find this block of code in the "NLD_Main.mq5" file ...
... and either delete it, or change it to better suit your needs.
Btw ... I've just released a minor update now, where that code block changes to make all candles visible when using fixed scale, because I've found it annoying when high and low candles went out of scope. Anyway ... this is how the modified code block looks like (from the latest update) ...
Hi Nelodi
Also thanks for updating the code.
Thanks for detailed early reply,much appreciations for pointing from code points of view.
I adjust it from chart property by fixing it,the other way.
1=Do you think "Trade panel" width vertical wise can be decreased,because it takes about half of chart space when we keep visible all functional tabs,may be a third row for tabs.
2=Do you think "Trade panel" histo formation speed can be slow down/decreased,because till a user understand where price is going in what direction,the histogram move fast in left and hide immediately, may be it effect/form after 2 or 3 ticks,any idea by your self.
All i wrote from a users point of view,how it can be more easy to understand and handle by a user - again big thanks - :)
regards
1=Do you think "Trade panel" width vertical wise can be decreased,because it takes about half of chart space when we keep visible all functional tabs,may be a third row for tabs.
2=Do you think "Trade panel" histo formation speed can be slow down/decreased,because till a user understand where price is going in what direction,the histogram move fast in left and hide immediately, may be it effect/form after 2 or 3 ticks,any idea by your self.
1. Sizes of all Buttons on the Trade Panel will be updating dinamically to match the Height of the Sub-Chart, so all you need to do is manually resize the Chart by dragging the horizontal line that separates the Main chart from the Trade Panel and set it to the size that suits you best. If buttons don't update immediately, you can select "Refresh" from the Chart pop-up menu or change the Time-Frame to force a refresh.
2. Left side of the Trade Panel is the Tick Chart, which is updating with every Tick you get from your Broker. The purpose of this chart is to see all the data as it arrives. The only way to "slow it down" is to zoom in your chart (select the chart and press the minus key "-" on your keyboard / to zoom out again press the "+" key), because a Tick takes the same space as a Candle on your main chart.
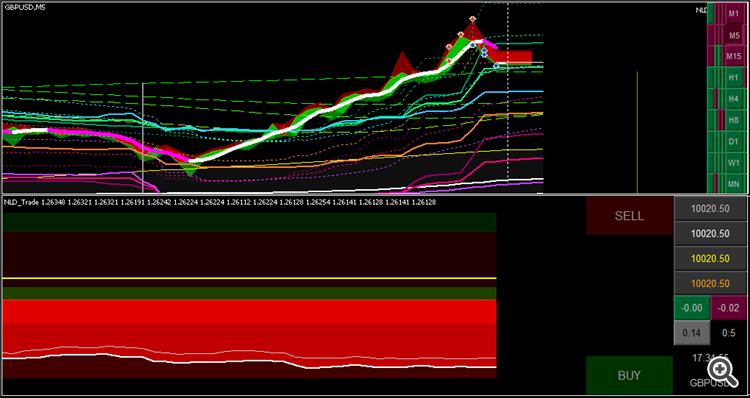
PS. You might also want to move the "Chart shift" line on the Main chart more to the right, to fill the space between the BUY/SELL buttons and the 1st tick in the Tick Chart, which would also make more bars visible (on the tick chart and the main chart). For example, here is how my chart looks like ...
mntiwana:
May i know,when i zoom in/out (vertically) for to best suit me it get back on default,can it is coded the way that a user can adjust it according to his suitability.
I've released an update for "NLD_Main.mq5" with a new input parameter "Auto-Scale Chart" (iAutoScale), which you can now set to FALSE in case you do NOT want the Main chart to be scaled automatically, or TRUE (new default value) if you want that feature activated (that is what I use).
Updated "NLD_Expert" with a new input parameter: "Avoid Hedging" (default value = TRUE).
When "Avoid Hedging" is TRUE, the behavior of BUY and SELL buttons changes. Instead of opening a new BUY or SELL position, the EA checks if there is a position open in the opposite direction (there is an open BUY position when you click SELL, or an open SELL position when you click BUY). If there is, instead of opening a new position in your desired direction, the EA will be closing one position from the opposite direction. In other words, if there are one or more SELL positions open when you click the BUY button, and the "Avoid Hedging" input parameter is set to TRUE in the "NLD_Expert", the last SELL position you've opened will be closed instead of opening a new BUY position. And the same goes for clicking the SELL button when a BUY position is open, it closes your last BUY position instead opening a new SELL position.
I've released another update, which basically only switches the color of two higher envelope lines (2p thick and dotted lines).
Before the update, bright lines were used for envelopes based on the lowest price, and dark lines were used for envelopes based on the highest price. This made down-trends easier to recognize, because the price would usually move down between two bright lines (lower highs and lower lows), but ... since up-trends are usually formed when there are higher highs and higher lows, using dark colors for highs resulted in up-trends usually moving between dark colored lines. And if you've trained yourself to recognize down-trends, you might have come to the conclusion that the price would usually be moving between the two bright lines and continue doing that as trend changes direction and the price moves up, but that isn't really the case.
Now (after the update), bright lines are used for "outside" envelopes (higher highs and lower lows), while dark lines represent "inner" envelopes (lower highs and higher lows). With that change, down-trends and up-trends are usually moving inside one bright line (outer bound) and the center. What it also means is that bright lines will usually be on the outside of the envelope when the price is trending and would usually move to the inside when the price is consolidating, or the trend weakens. It isn't always the case, though, so ... make sure to look at price movement and all the lines when making your trade decisions, not just the envelopes.
I've just released another update, which affects the way the "NLD_Expert" selects the position to close from the opposite direction of your trade when the "Avoid Hedging Trades" input parameter is TRUE.
When the "Avoid Hedging Trades" input parameter on "NLD_Expert" is TRUE (default value) and there is a position open in the opposite direction (SELL is open when you click BUY, or BUY is open when you click SELL), the "NLD_Expert" is going to close the best performing position (a position with the highest profit / lowest loss) from the opposite direction, instead of closing the last position open in the opposite direction. With this update, it does not matter anymore if you were adding more volume as your trade became more profitable, of if you keep adding volume to get a better price. In both cases, the position to be closed first would be the one with the best performance. This change does NOT have any effect on your Equity, but it minimizes the negative effects to your Account Balance when closing losing positions and maximizes your realized profits when closing profitable positions.
And ... here is another minor update, adding a new option to the Trading Terminal, which I personally find useful when a trade has gone wrong, you are NOT using hedging, but want to wash out of it.
After adding the "Avoid Hedging Trades" option to the "NLD_Expert" (see my post above), the button used to show TOTAL floating profit of open BUY and SELL positions was no longer relevant if "Avoid Hedging Trades" was TRUE (since it would be identical to the floating profit/loss of your SELL or BUY positions, depending on the current direction of your trades), so ... I've added a new input parameter "BUY/SELL Center" to the "NLD_Trade" indicator, which now has 3 options and allows you to choose what the button in the center between BUY and SELL buttons should be used for (and what to display):
- "Close All" - shows a TOTAL of all open positions (useful ONLY if "Avoid Hedging Trades" is FALSE)
- "Bank Profits" (new default) - shows a total for all open positions currently in PROFIT, which could be closed now to BANK all your PROFITS
- "Cut Losses" - shows a total of all open positions currently in LOSS, which could be closed now to CUT your LOSSES (accept the loss displayed and move on)
- Free trading apps
- Over 8,000 signals for copying
- Economic news for exploring financial markets
You agree to website policy and terms of use


NELODI Trading Terminal for MT5:
NELODI Trading Terminal is a collection of Indicators and an Expert Advisor, which work together to provide a complete solution for manual Trading, primarily designed for Scalping.
Author: NELODI