Tom_Hoang's Forex Trading Analysis-Journal
Technical Analysis Forex Trader:
When I began to study to trade Forex, I studied all three: Technical Analysis, Fundamental Analysis, and Sentiment Analysis.
There is no question that the Forex is a NEWS driven market so the Fundamental Analysis seems more sense to analyze the market. But I figure out that as A Day Trader, I do not have much knowledge, time, and experience to really guess the market based on my Fundamental Analysis. Only Smart Money(Big Bank, Big Company) can do it.
The Fundamental Analysis has an advantage so we can predict the trend of the market at the very beginning if you become very good at it. I do not think I can follow the market based on my FA so I became a T.A. Trader.
So therefore, I learn a basic of Fundamental Analysis (20%), a lot Technical Analysis (60%), some of Sentiment Analysis (10%) , and Professional Trader Experience (10%).
After all, I never guess the market but to follow the market based on science. And Technical Analysis Trader does it very well. Make money from the middle.
Trades Prepare for Every Trades: Plan the Trades and Trade the Plans
Step 1: Analyze the pairs
Identify the trend: up, down, no trend by using chart patterns, indicators, Japanese candlestick patterns, and Proven Trading System.
Step 2: Trades Setup: Stoploss, Entry, Target Price based on the analysis.
- Using previous Top, Bottom, Fibonacci Level, Pivot, Trendline for Stoploss Price, Target Price.
- Using Stop, Limit Orders and RSI Indicator of lesser Time Frame (Trade H4, use H1)for good Entry Price .
- Calculate the Trade's Size = (equity x %risk) / (abs(entry price - stoploss price) x 10^5) (k lots)
Step 3: Money Management
-Determine the Risk for each trade:
Long Term (Daily, H4 Chart): < 2% of equity
Short Term (H1, M30 Chart): < 4% of equity
Step 4: Trade Management
-Watch the indicators, Proven Trading System if the trend follow the plan or not.
-Never move Stop-Loss if the plan is wrong, Accept Plan. The Stoploss was planning for such case.
- If the trend follow the plan: Move stoploss to break even, or Lock in profit.
Step 5: Always Have a Journal/Record for Each Trade
- Learn from the mistakes.
- Have a Journal will lead me to a Discipline Trader.
Happy Trading.
Merry Christmas and Happy New Year.
Hi Tom,
It is good to see and I am very happy for you that you are so far developed in your understanding and experience of day trading that you now trade full-time and make your living from it. That is great. I plan to do the same.
You have been studying and getting experience in day trading for 5 years. You trade the M30, H1, H4 and Daily charts. I have been studying and getting experience in day trading for 28 months by now. I trade on the M3 and M4 as my short period entry charts and then move on to the M5, M6, M10, M12, M15, M20 and M30 as I follow a long move. I only trade the Euro/Dollar. I only day trade, that is intra-day. I only use 50 leverage. I am still on the Demo. I have traded live at the start, more than two years ago, but after quickly losing 42% of my deposit I realized that I have to follow the advice that I must first become profitable on the Demo platform before I go live again.
I spent the first two years trying to develop a trading plan on the M1. By now I have put the M1 and M2 charts to eternal sleep, for me. I will never set them up again.
My M3 trading plan is much more manageable. I am trying for perfection since I believe that is the only correct way. See my thread under the Trading System section of this Forum: "There certainly is a Holy Grail!".
I do agree that a longer time frame gets rid of the false signals on the shorter time frames.
My trading plan is based on (1) a customized Stochastic as my first and leading signal - the one on which I enter or exit or take profit or loss, (2) a customized MACD as my main confirmation indicator plus (3) the 10 crossing 50 moving averages mainly as long move signals. I line my customized Stochastic bottom BUY and top Sell levels up on all or as many as possible time frames from M3 to the Monthly chart. I watch all my charts and indicators from the M3 to the H4 all day long. That´s it. Obviously I use support and resistance and trend lines. Everyone does that.
I trade the European Session together with the New York session as one 17 hour trading day from 5 am (Frankfurt open) till 22 pm (New York close) my time at GMT.
I am honest in admitting that it is highly likely that I may also abandon the M3 and move on to a higher time frame as my short period entry chart. I may eventually land up on the M30 where you are now as your shortest time frame. I agree, I may still do the same. At the moment I am still exhausting my ability to develop a trading plan I am able to follow correctly from the M3 up.
I will follow your progress with interest on this thread.
Good luck!
Well, you don´t actually need good luck. Successful trading is not based on lucky trades. You have a profitable trading plan.
So, good trading!
Happy New Year!
Long Term Plan: January 2018
- Sell USD/JPY Daily Chart
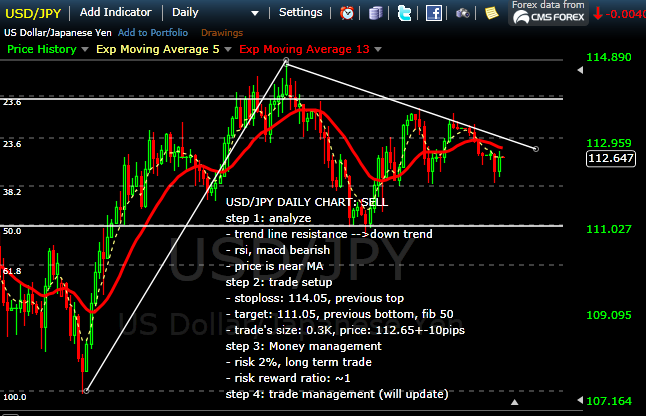
UPDATE: 01/04/2018

2. GBP/AUD Daily Sell
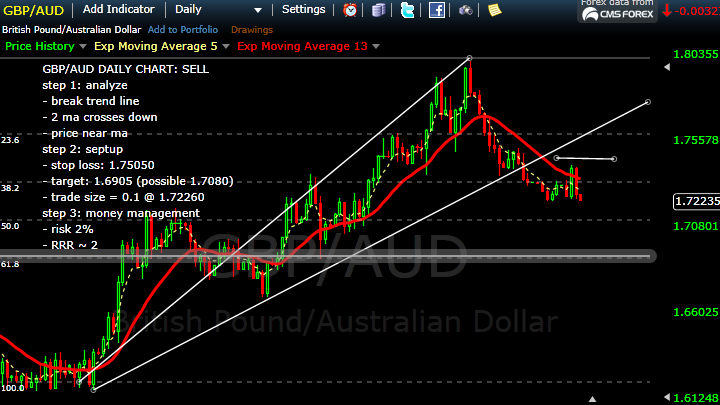
UPDATE: 01/04/2018
ADD SIZE: SELL 0.2 GBPAUD @ 1.72289
Hi Tom,
It is good to see and I am very happy for you that you are so far developed in your understanding and experience of day trading that you now trade full-time and make your living from it. That is great. I plan to do the same.
You have been studying and getting experience in day trading for 5 years. You trade the M30, H1, H4 and Daily charts. I have been studying and getting experience in day trading for 28 months by now. I trade on the M3 and M4 as my short period entry charts and then move on to the M5, M6, M10, M12, M15, M20 and M30 as I follow a long move. I only trade the Euro/Dollar. I only day trade, that is intra-day. I only use 50 leverage. I am still on the Demo. I have traded live at the start, more than two years ago, but after quickly losing 42% of my deposit I realized that I have to follow the advice that I must first become profitable on the Demo platform before I go live again.
I spent the first two years trying to develop a trading plan on the M1. By now I have put the M1 and M2 charts to eternal sleep, for me. I will never set them up again.
My M3 trading plan is much more manageable. I am trying for perfection since I believe that is the only correct way. See my thread under the Trading System section of this Forum: "There certainly is a Holy Grail!".
I do agree that a longer time frame gets rid of the false signals on the shorter time frames.
My trading plan is based on (1) a customized Stochastic as my first and leading signal - the one on which I enter or exit or take profit or loss, (2) a customized MACD as my main confirmation indicator plus (3) the 10 crossing 50 moving averages mainly as long move signals. I line my customized Stochastic bottom BUY and top Sell levels up on all or as many as possible time frames from M3 to the Monthly chart. I watch all my charts and indicators from the M3 to the H4 all day long. That´s it. Obviously I use support and resistance and trend lines. Everyone does that.
I trade the European Session together with the New York session as one 17 hour trading day from 5 am (Frankfurt open) till 22 pm (New York close) my time at GMT.
I am honest in admitting that it is highly likely that I may also abandon the M3 and move on to a higher time frame as my short period entry chart. I may eventually land up on the M30 where you are now as your shortest time frame. I agree, I may still do the same. At the moment I am still exhausting my ability to develop a trading plan I am able to follow correctly from the M3 up.
I will follow your progress with interest on this thread.
Good luck!
Well, you don´t actually need good luck. Successful trading is not based on lucky trades. You have a profitable trading plan.
So, good trading!
Happy New Year!
Thanks for Comment!
And it is a good, solid comment.
In my opinion, the charts which are lesser than M30, are too fast and difficult to analyze. For example, if you drive a car at 150mph, you can not control it well when the conditions are changed. For me, its principle applies the same to market.
And there is no perfect solution, trading system, automated trading to help us make $$$ in this market. My 2 cents.
It seems you have more opportunities at lesser time frame, but only market noises. And we both agree!
With the M30 and trade it with 3 pairs, there will be enough trade's plane for us to make money not mention the H1, H4, Daily for long term.
Also, try to get back your confident. It is the most important. Then make a basic plan with your trading system and T.A, watch out for Big News to avoid volatility.
Feel free to check my idea and using the trading's plan procedure, I copy it from professional Trader too. I use it for every trade and I make good profit.
Happy Trading @PennySeven
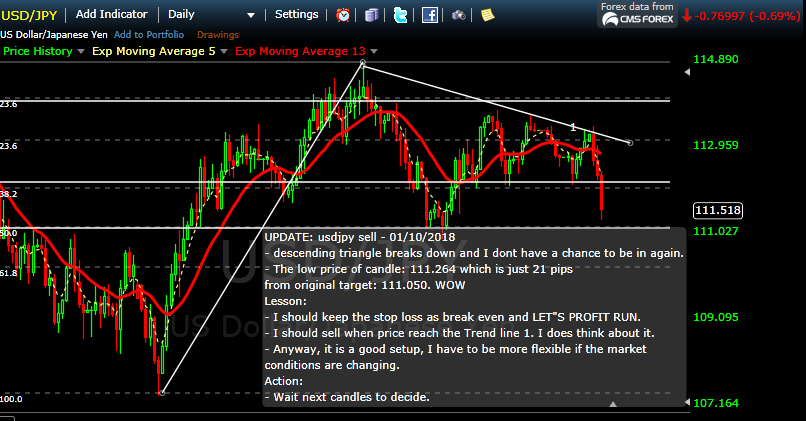
Long Term Plan: January 2018
- Sell USD/JPY Daily Chart
UPDATE: 01/09/2018
- Trend line 1 is valid.
- MA 13 is flat.
- Descending triangle, will the price pop up or down?
Action:
- If the price break 112.00 price level, consider add position.
- Move stoploss to break even: 112.550
-----
UPDATE: 01/09/2018, 9PM
- Close Trade at 112.185 for first trade of the year.
- Profit: 38 pips
- Reason Close: H4 Chart show that RSI = 27 = Over sell. Strong Support at 112.00 Price level. So I decide to close this trade and keep watching if the Price breaks up or down the Descending Triangle.
Lesson:
- I enter the trade a bit early.
- I should wait the price near the trendline 1 to sell or the price breaks the 112.00 level to sell.
---------------------------------------------------------
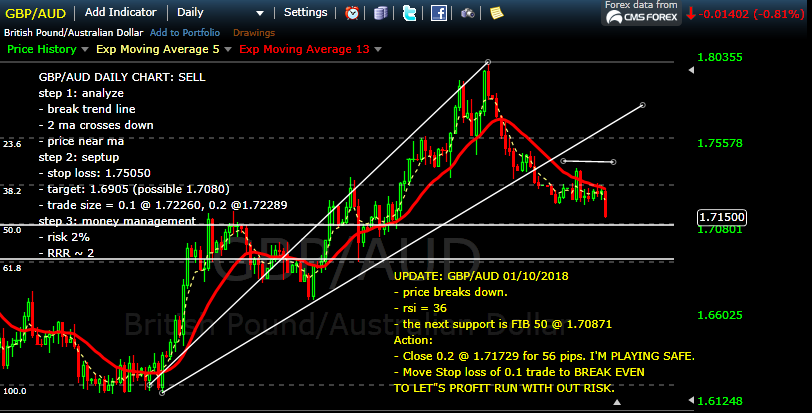
2. GBP/AUD Daily Sell
UPDATE: 01/09/2018
- Price is still under MA 13.
- Last candle is spinning top candle.
Action:
- Traders are indecision, price is traded around Fib 38.2 Level.
- If Next Candle's Closing Price is above MA 13, MACD is Positive, I will close this trade.
UPDATE: GBP/AUD 1/10/2018: LET'S PROFIT RUN
Tom,
What leverage do you use?
Tom,
What leverage do you use?
1:50
- Free trading apps
- Over 8,000 signals for copying
- Economic news for exploring financial markets
You agree to website policy and terms of use
Hello MQL5 Community!
My name is Tom, and my background is computer science.
I began to study and practice trading Forex since 2012 as a Part-Time Trader.
Trading is a very hard game so I always study, update my knowledge and trade based on my own analysis and my proven trading system.
My trading system is based on Technical Analysis to follow the Trend not to forecast the Trend according to the trades with high probability.
I also apply Trade Management, Money Management(Never Risk more than 2%), and Trading Journal (Analyze Trades) to have a high percent winning as Forex Trader.
Some of the books I read: Technical Analysis (Murphy), Come into My Trading Room (Elder), The Complete Trading For a Living (Elder), Japanese Candlestick (Nison).
In 2018, I decide to be a Full-Time Forex Trader and trade for a living!
I will post my analyze, trade prepare... in this Trading Journal.
Yes, That's it. If you have any question, Please send me a message. And Feel free to have any comment.
Thank You and Happy Trading.