Daily Forex Technical Analysis - page 6
You are missing trading opportunities:
- Free trading apps
- Over 8,000 signals for copying
- Economic news for exploring financial markets
Registration
Log in
You agree to website policy and terms of use
If you do not have an account, please register
GOLD TECHNICAL ANALYSIS – Prices broke higher as expected after putting in a bullish Morning Star candlestick pattern. Resistance is now at 1321.09, the 38.2% Fibonacci retracement, with a break above that targeting the 50% level at 1342.57. Near-term support is at 1294.51, the 23.6% Fib.
Forex Technical Analysis EUR/USD 2013.10.21
Positive structure in the currency pair remains strong with recent lift to 10-month peak at 1.3701. Prices are also waving above the SMAs increasing further bullish chances confirmed by rising trend line.The Average Directional Index confirms the price pattern by indicating strong upside. However, we have the first weakness signal by Relative Vigor Index, bearishly diverging from price arrangement, suggesting that a corrective dip could be on the way but no contrarian expression justifies that.
Therefore, in our view we favor further upside by breaching 1.3700 and heading towards 161.8% Fibonacci level at 1.3751 but we remain cautious on reversal from current level ahead of tomorrow’s NFP report.
Forex Technical Analysis AUD/USD
2013.10.22
The currency pair has been consolidating just below 161.8% Fibonacci extension of0.9535 to 0.9278, at 0.9678 with longer term structure being bullish. Moreover, the 100 and 50 SMAs formed a golden cross increasing chances for further highs.Looking at the oscillators, MACD confirms the positive price pattern, however theStochastic at extreme peaks suggesting being contrarian although not confirmed byOsMA.
In our opinion prices have serious chances to rise above cap at 0.9678 and head for0.9943 nonetheless overbought Stochastic raises some concerns while NFP report later today could trigger a corrective move.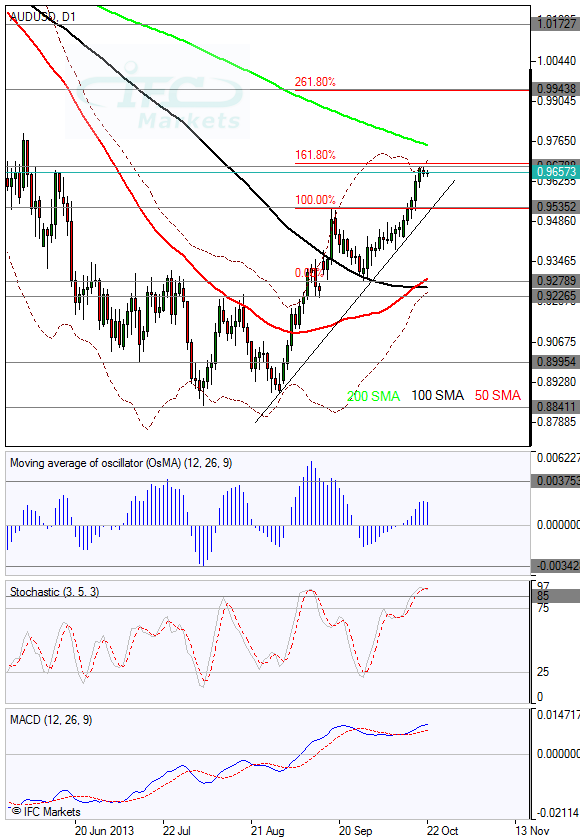
Forex Technical Analysis USD/JPY
2013.10.25
The currency pair is testing the surging up trend line at 97.00 of a potential symmetrical triangle pattern. According to the theory the triangle is a continuation pattern thus the uptrend line could hold prices and induce them to test falling trend line at 99.00 since previous trend was up. However, in case of falling below 97.00 we would consider it a reversal pattern favoring downside.Oscillators have limited capabilities since trading range has narrowed significantly in recent trading. Nevertheless, MACD is below zero as well as lower than its signal line and RSI(14) is down trending, both reinforcing weakness chances.
We consider it very interesting to watch USDJPY’s development and we would take the opportunity to follow any breach of the surging trend line at 97.00 since it could be an early signal of a longer term downtrend establishment. Due to high risk strategy we use tight risk/reward ratio.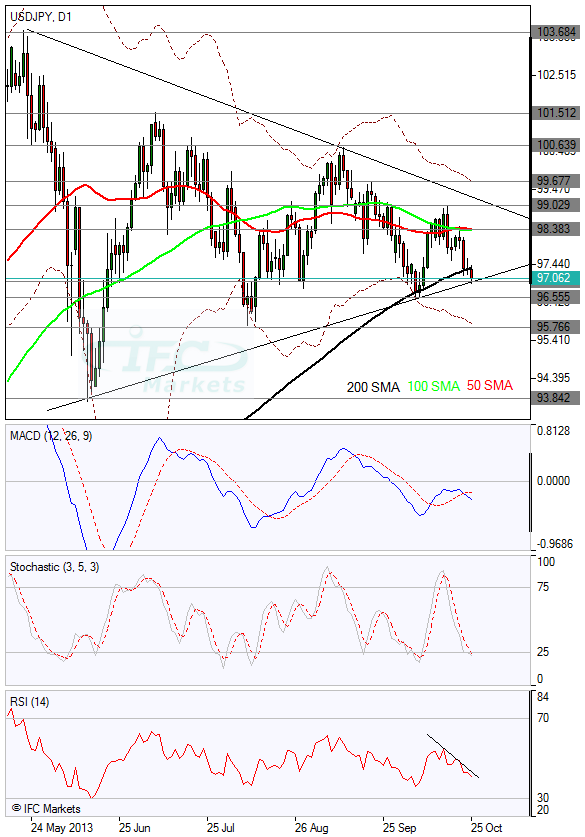
CFD trading on Apple and Microsoft
Hello,
I’m the representative of IFC Markets, and in this tread I’d like to draw to your attention CFD trading on shares.
IFC Markets offers a wide range of Share CFDs: like Apple, Microsoft, American Express, Facebook, Western Union, Toyota Motor, Nokia, etc. And what is the most important IFC Markets offers 1:40 leverage for trading Share CFDs.
I’d be happy to hear your opinions about CFD trading, and if you have any questions I’m always eager to answer them.
Hope to hear from you soon.