Daily Forex Technical Analysis
Daily Market Overview
RBA Cut Key Rate to 2.5% Still AUD/USD Gains Ground
The Reserve Bank of Australia cut key rate by 0.25% to a new record low at 2.50%. At its statement the RBA though did not sounded as dovish as expected providing some support for its currency. More specifically Glenn Stevens said that growth has been a bit below trend over the past year, unemployment rose while inflation remained low providing space for rate cut. Lastly said for forward guidance, the policy would be adjusted as needed to foster sustainable growth after assessment of the outlook with inflation consistent with its target. Indicating that RBA does not plans to ease further this level of accommodation. Still, market participants have been expecting more dovish comments by RBA and that could explain AUD/USD advancement from 0.8904 to 0.8988. In contrary Aussie Trade surplus was at 600 million in June, lower than expected but higher from previous month trade surplus, while House price Index surprisingly increased by 2.4% in June from 0.8% the previous month.
Profitable Trading Method
The company NetTradeX with the support of Forex broker IFC Markets has developed a revolutionary method of portfolio analysis and trading – GeWorko method.
GeWorko Method is an innovative approach to financial markets research and analysis. It allows to create portfolios from a variety of financial assets and reflect the value of one portfolio relative to another in a historical retrospective.
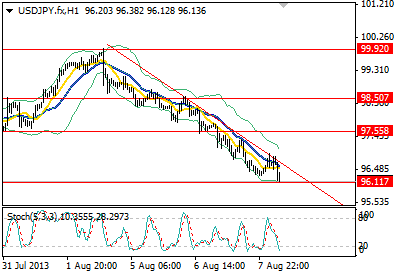
Forex Technical Analysis USD/JPY 2013-08-07Downside bias prevails in the currency pair trading with prices today falling to more than a month low at 96.88. Falling line indicates dominating trend confirmed by MACDbeing in negative territory and looking downwards, thus we consider chances are more for prices to achieve 96.17 rather than the 97.60. Nonetheless, we cannot ignore that Stochastic is in the oversold zone suggesting caution on short positioning, alsoOsMA approached dangerously previous troughs line.
To conclude, since we are in downtrend it is normal for oscillators to approach extreme down levels but as long as both OsMA and Stochastic drop below their previous bottom lines, subjectively set at -0.2187 and 11 respectively, we would avoid further short positioning.
Daily Forex Technical Analysis by IFC Markets
Forex Technical Analysis GBP/USD 2013.08.08
The sterling against the greenback formed a reversal pattern suggesting trend is positive however we are concerned because this reversal took place between 1.5754/1.4832 wide range. OsMA suggests as well that uptrend prevails coupled by surging RSI but still we would like to see prices rising above 200 SMA at 1.5542 for further confirmation. In addition, current long term wide range suggests that prices would be limited by 1.5754/1.5605 resistance zone, thus we would take a conservative long position should the 1.5542 is breached with target around 1.56.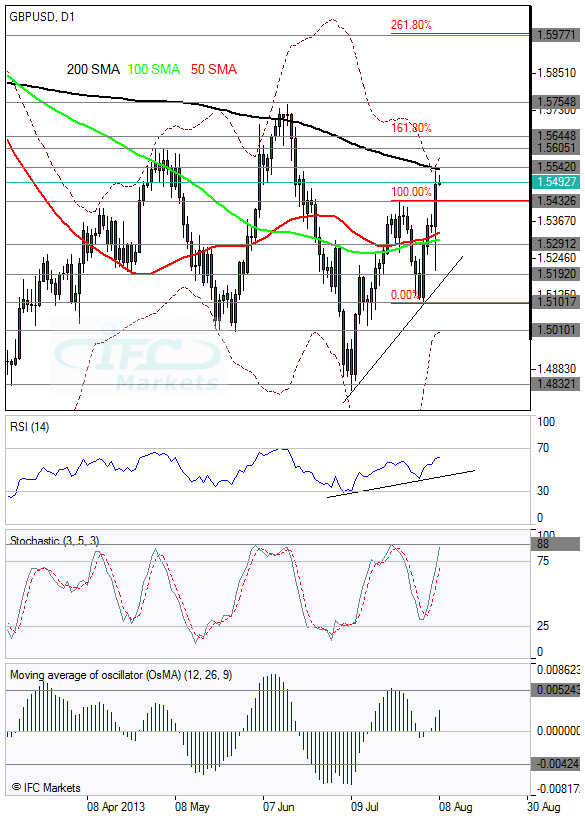
Daily Market Overview by IFC Markets
The Bank of Japan at its monetary statement announced that will continue with quantitative and qualitative monetary easing for as long is needed to achieve inflation of 2% with CPI data signaling that is on the right path as inflation turned positive in June. BOJ maintained current monetary stance of increasing monetary base by 60-70 trillion Yen per annum, as well as key rate at record low level of 0.0-0.10%.
The Japanese Yen strengthened against its major counterparty with the USDJPY pair drawing a resistance earlier at 96.82 and falling to fresh 1 ½ month low at 96.11. The downtrend is well established with recently supportive data for the Yen, thus we would expect lower levels in the intraday but we will minimize exposure before US Jobless Claims.
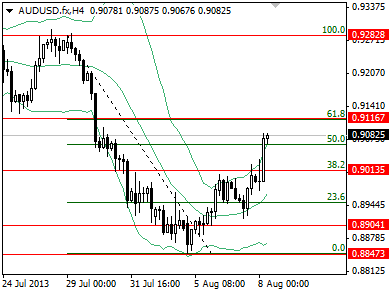
Chinese Trade Surplus narrowed to $17.8B in July but that was due to increasing Imports by 10.9% and Exports by 5.1%. Aussie was well underpinned by CNY Trade data as its major trader counterparty is China. The AUDUSD corrected higher to 0.9086 with intraday bias being bullish we would expect the pair to go up to 61.8% of 0.9282 to 0.8847, at 0.9116
Yesterday Bank of England Governor, Mark Carney, introduced policy guidance with knock out criteria for safekeeping price and financial stability. Inflation was in June at 2.9% and is expected to cool down to 2.0% in 18-24 months while growth outlook was upgraded by BOE amid recent improved GDP data and confidence indicators. Concerning Policy Guidance, monetary stance would not tighten unless unemployment rate reduce below 7.0% threshold while asset purchases could increase if warranted. Unemployment rate is currently at 7.8% and projected to drop to 7.3% in 2-year time. However that relation between monetary policy and unemployment rate will be “knocked out” if firstly, inflation in 18-24 months is estimated to be above 2.5%, second inflation expectations are not well anchored and third financial stability is threatened. In our opinion BOE is becoming more effective in setting monetary policy with accommodative stance remaining unchanged that has a positive impact on sterling value. The GBPUSD edged up to 1.5530, overpassing key resistance at 1.5415 and could go up to 1.56.
Forex Technical Analysis GBP/USD 2013.08.16
Upside bias drove the currency pair yesterday to 161.8% extension of 1.5432 to 1.5101, at 1.5644. At the moment prices are consolidating just below that resistance but are likely to breach that level and rise as high as the upper boundary of the 1.5751/1.4832 longer term wide range. The only factor that concerns us is that the Williams’ percent range is at its top although not confirmed by Oscillator, in addition the GBPUSD rose above 200 SMA. Thus in our view it has serious chances to test the top of the range at 1.5751.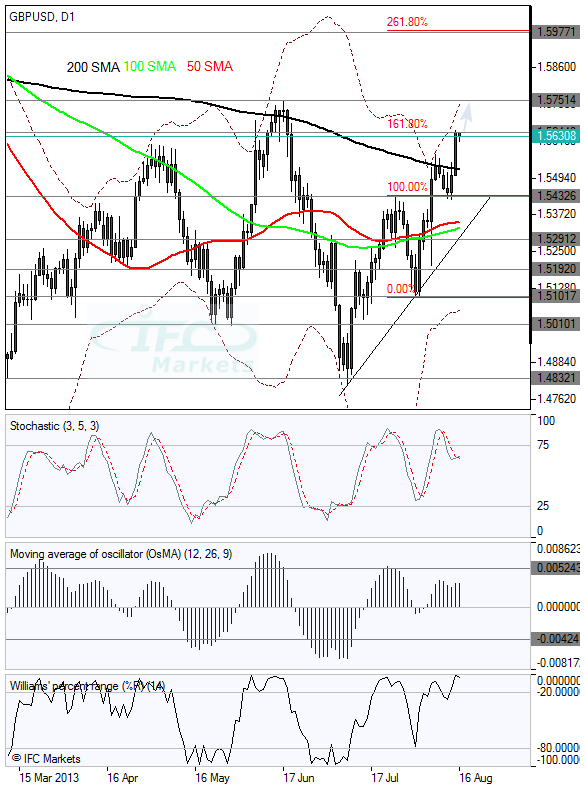
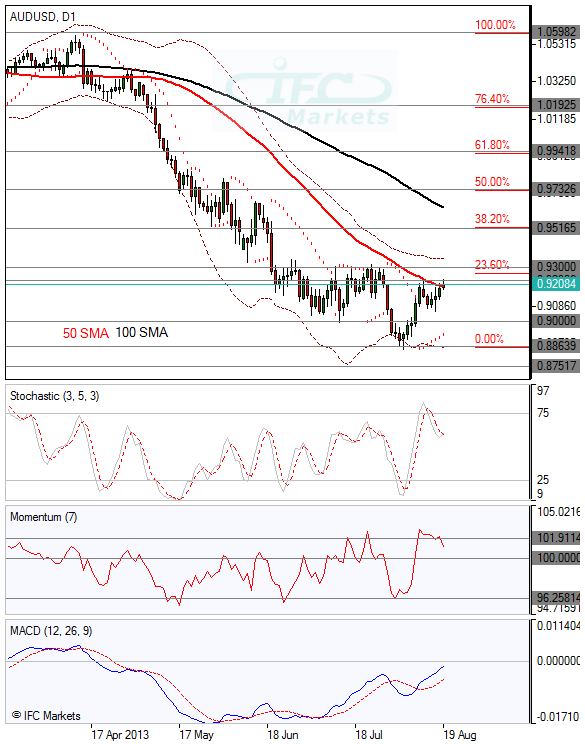
Forex Technical Analysis AUD/USD 2013.08.19
Corrective move seems to be well limited by resistance at 0.9230 which is slightly below the 23.60% of the 1.0598 to 0.8863 and the previous key resistance at 0.93. Down trend remains in place in the price pattern and the last upside is considered a corrective move before prices resume their negative development.Stochastic has just escaped its overbought zone and heading downwards increasing chances for negative resumption, adding to that Momentum (7) is near its peak level. However, Parabolic SAR still provides buy signal reducing chances for downside.
Therefore, we consider prices would be limited by resistance zone between 0.93/0.9230 and we would expect the currency pair more likely to fall back to 0.90 than to rise above 0.93 or at least extend into 0.9230/0.90 sideways zone.
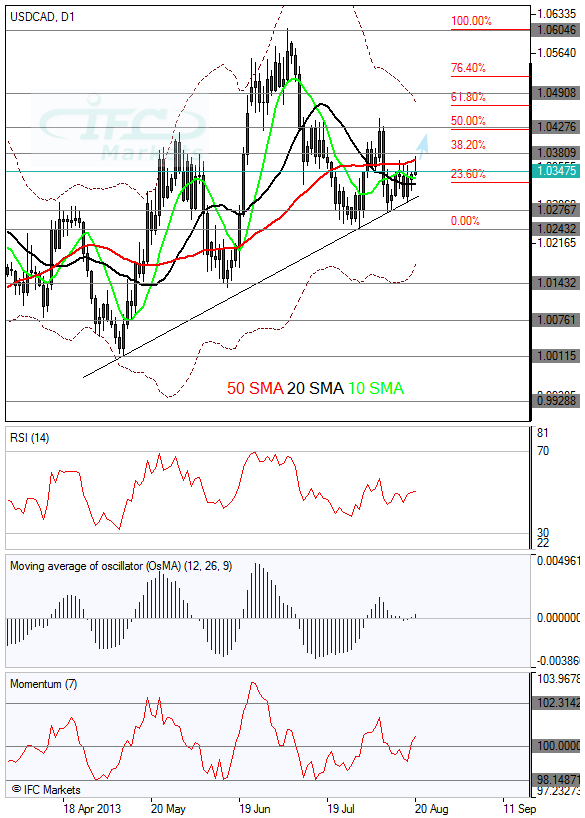
Forex Technical Analysis USD/CAD 2013.08.20
The currency pair respected the surging line and did not fall below support at 1.0276, although upside has been limited in the last trading session by resistance at 38.2% Fibonacci level of 1.0604 to 1.0243, at 1.0380. Thus, prices are mainly extending into 1.0380/1.0276 sideways zone.
For that reason oscillators do not provide much of help regarding forecasts, except that Moving average of oscillator is positive favoring upside even that though is minor. We can base our view on the longer term surging trend that increases chances for further ups. Thus, we consider more likely for the pair to achieve 1.0427 than to drop below 1.0276.
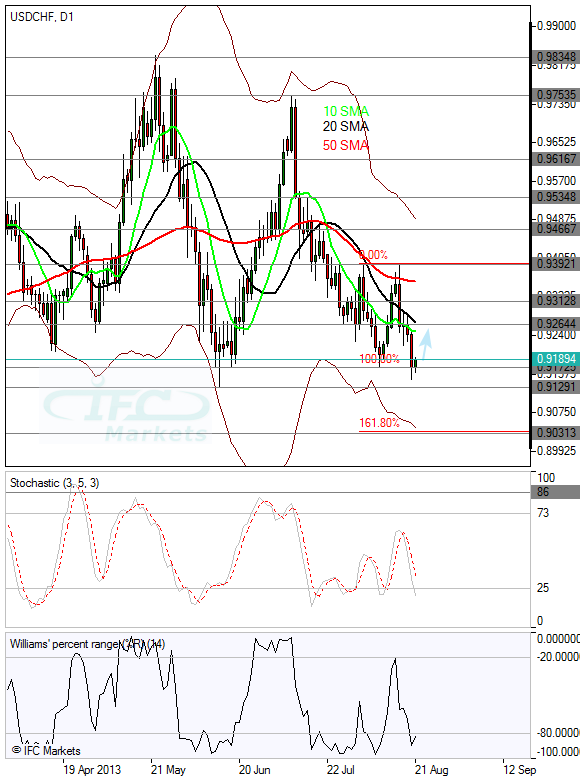
Forex Technical Analysis USD/CHF 2013.08.21
The currency pair approached once more the lower boundary of the long-term 0.9834/0.9129 sideways zone with the downside bias prevailing in yesterday’s trading but limited around support at 0.9172.Looking at the oscillators, the Stochastic just entered oversold territory coupled by Williams’ percent range being at oversold, both suggesting a technical retreat higher. Thus, due to oversold oscillators and prices near bottom of 0.9834/0.9129 range, we would expect a bounce up to resistance around 10 and 20 SMA at 0.9264.
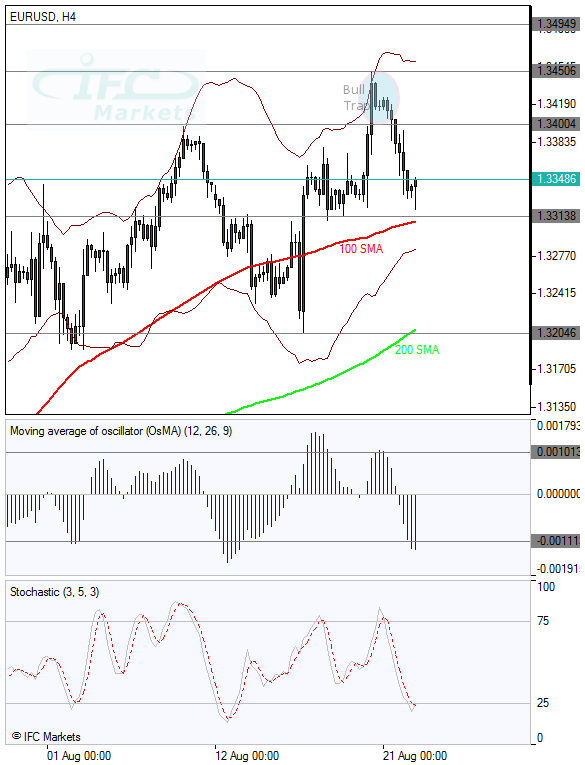
Forex Technical Analysis EUR/USD 2013.08.22
The currency pair rose above the previous key resistance at 1.3400 inducing traders to follow on the long side but then suddenly dropped sharply to create a “bull trap” pattern. That pattern increased weakness and drove prices down to 1.3313.Currently, oscillators are around extreme down levels with the Stochastic falling into oversold territory and OsMA fluctuating at previous troughs line. Thus, we consider bearish momentum power has faded with support at 1.3313 near SMA 100 likely to hold any attempt lower and we would expect prices to extend into 1.34/1.3313 area in the intraday.
- Free trading apps
- Over 8,000 signals for copying
- Economic news for exploring financial markets
You agree to website policy and terms of use
Forex Technical Analysis EUR/USD 2013.08.06
The currency pair seems unable to decide a direction, fluctuating between 1.3313/1.3198 tight range in the recent term. Looking at the longer term daily history the pair is trading in 1.3416/1.2747 wide range zone with prices near the top of that range, increasing chances for downside. In addition Stochastic has recently escaped from the overbought area coupled by longer term Williams Percent Range topped at 0.00, lastly the Relative Vigor Index (RVI)provided a sell signal as its signal line was crossed from above.