Daily Forex Technical Analysis - page 4
You are missing trading opportunities:
- Free trading apps
- Over 8,000 signals for copying
- Economic news for exploring financial markets
Registration
Log in
You agree to website policy and terms of use
If you do not have an account, please register
Forex Technical Analysis USD/JPY 2013.09.23
Downside bias has already driven the currency pair lower in today’s trading and as the falling trend line suggests the pair could go even lower towards support at 61.8% of 97.75 to 99.66, at 98.50. At that level, we observe previous lows as well as the 200 SMA, thus appears to be a strong support.Looking at the oscillators, MACD is neutral fluctuating around zero line but Stochastic is entering oversold area with limited free space to the negative side, therefore we cannot anticipate much downside today and tomorrow. Furthermore, in the longer term a symmetrical triangle is forming with lower highs and higher lows which could provide a direction and target price on the breakout.
Forex Technical Analysis USD/CAD 2013.09.24
In the longer term we can observe that the penetration of the “failure swing” neckline at 1.0241 was not credible since in the weekly chart did not close below that level, instead it bounced back above that creating a spike. We could consider this as a “bear trap” in the daily chart or a fake break in the weekly chart as it is shown below.SMA 50 provided support to the currency pair and induced it to return back up failing to close also below surging trend line in the weekly. MACD remains above zero line reinforcing the weakening up trend, whle OsMA is bearish but near previous troughs line. We would expect the pair to remain above the support at 1.0180 unless we have another round of substantially negative news for US dollar, with next resistance target at 1.0341.
Forex Technical Analysis EUR/USD 2013.09.25
Upper Bollinger band weighed on the currency pair coupled by overbought Stochastic and Commodity Channel Index being above 175 line, thus resistance line was drawn at 1.3562. Prices have retreated afterwards reaching almost support at 1.3450, increasing validity to uptrend pattern and previous bullish breakout.At the moment CCI has a downward direction and OsMA is declining after reaching previous peaks line suggesting bearishness, however key support at 1.3450 make as cautious to further lows. In our consideration corrective move could go lower in the immediate term towards 1.3372 but we are cautious on that since medium term outlook is bullish thus we prefer to wait for upside resumption either at 1.3450 or 1.3372.
Forex Technical Analysis AUD/USD 2013.09.26
The currency pair was overextended up as was indicated by OsMA and Stochastic, thus it eventually drew a resistance line at 0.9505 and then softened to support at 0.9332. Oscillators have reset from overbought zones and therefore they do not hurdle resumption of the upside.The “double bottom” trading pattern formed between 0.9230/0.8841 range suggests that the medium term trend has reversed to positive. First target at 161.8% Fibonacci extension around 0.9464 achieved and now potentially looking towards 261.8% level however before that the 50.0% of 1.0578 to 0.8841, at 0.9707 may place a lid on prices.
Forex Technical Analysis USD/CHF 2013.09.30
Downside bias remains strong with prices sliding early on Monday to fresh eight-month low at 0.9022 and drawing a support line there with the lower Bollinger also placing a downside hurdle. Moreover, prevailing trend is negative as indicated by the falling trend line.Looking at the oscillators, MACD is below zero confirming weakness of the price pattern while there is now indication of contrarian signals. Therefore we would expect prices to continue under selling pressure and likely to make a new low in the following trading, heading towards 261.8% of 0.9083 at 0.9136, at 0.8992.
Forex Technical Analysis USD/JPY 2013.10.01
Surging trend line was breached in earlier trading increasing potential for weakness in the currency pair. In addition, prices formed a “failure swing” pattern with neckline at97.74 with 100 and 50 SMA weighing on prices, however today they returned back above the 97.74 underpinned by some macro events.Concerning oscillators,MACD dropped into negative territory and RSI (14) is down trending suggesting downside bias. We consider that negative sentiment has strengthened although bulls still hold their ground due to recent return above the “failure swing” neckline.
Our opinion based on technical signs lean towards downward enhancement toward96.79, where the 161.8% of 97.74 to 99.66 is also nearly located coupled by 200 SMA.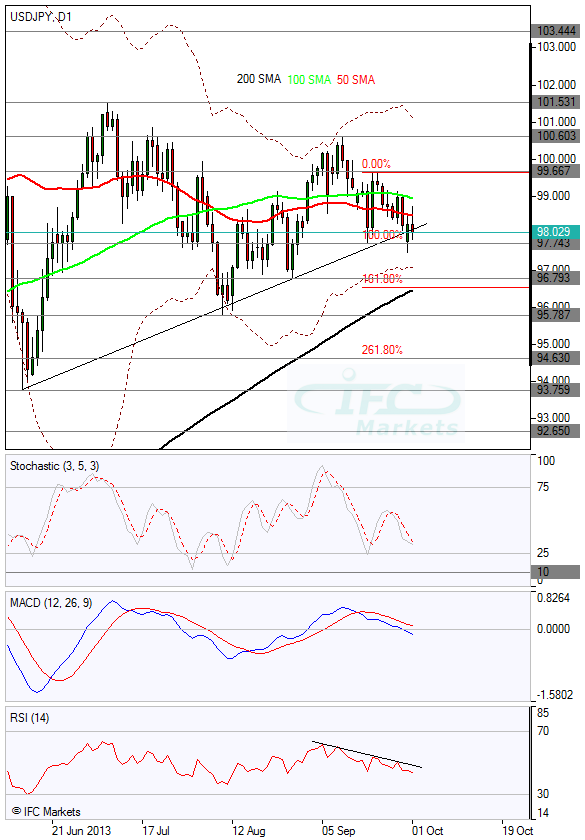
CFD Trading by IFC Markets
CFDs (Contracts For Difference) are traded in the most of the developed world. Because of the ability to trade CFDs on margin those are actually financial instruments that are generally traded by financial institutions to hedge against ownership in original assets, and by individuals and retail traders that speculate on its price direction.
CFD trading offers a number of advantages over trading the underlying asset directly. In addition to currencies, contracts for difference provide great opportunities for traders wishing to gain exposure on different markets.
Trade CFDs with IFC Markets: Index CFDs, Equity CFDs, Commodity CFDs.
Forex Technical Analysis USD/CAD 2013.10.02
Upside bias drove prices to resistance where 50 and 100 SMAs consolidate just below the 50.0% Fibonacci retracement of 1.0563 to 1.0180, at 1.0363. Previously we saw the currency pair forming a near double top pattern and breaching neckline at1.0243 but now the pair has climbed back to 1.0340, providing signs that is trading in a wide range.Looking at oscillators, Stochastic has been in earlier trading in the overbought zone providing a mild contrarian signal, coupled by SMAs weighing on prices and MACDbeing negative suggesting negative trend. However, MACD has crossed its signal line from below, partially offseting its bearishness. We consider chances are favoring in the immediate term reversal to negative bias and shifting focus toward 1.0243.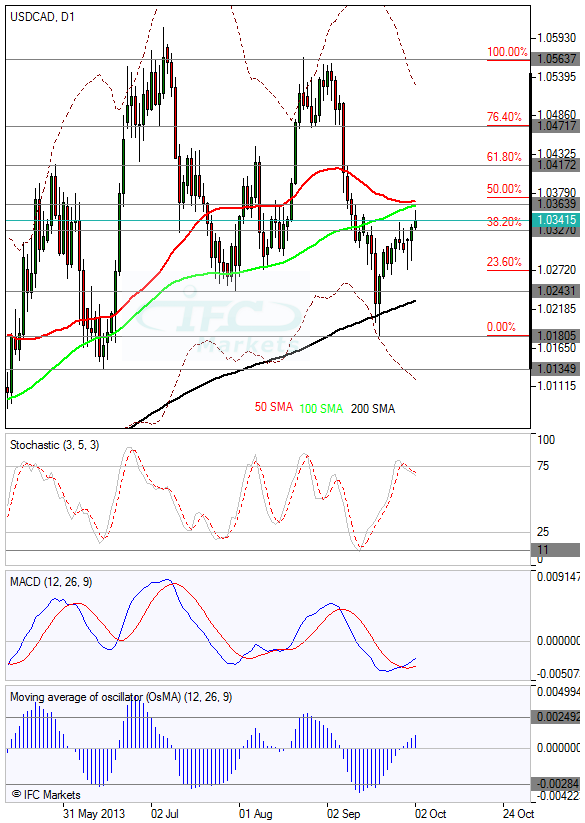
Forex Technical Analysis EUR/USD 2013.10.03
The currency pair rose to fresh 8-month peak after breaching cap at 1.3562 yesterday. Rising structure remains strong as indicated by surging trend lines with the most recent trend line being steeper suggesting upside is strengthening. Moreover, as you can observe all SMAs remain below prices not even providing any indication of short-term reversal.Concerning indicators, Commodity Channel Indexis upwardly moving rising above 100 and still has room until previous crests line. In addition, ADX indicates that bullish trend is strong and valid.
Therefore, we would expect the EURUSD to continue its upside toward 161.8% of 1.3450 to 1.3101, at 1.3661, followed by next resistance at 1.38.
Forex Technical Analysis AUD/USD 2013.10.04
The AUDUSD found support at 0.9278 where the 100 SMA is located and resumed its upside as we have expected and currently is moving towards cap at 0.9527. Tentative surging trend line is indicating that positive structure is more likely to continue.Our view that the pair would initially reach resistance 0.9527 and then likely to breach it targeting 161.8% of 0.9527 to 0.9278, at 0.9679 is also backed by oscillators.Stochastic is rising confirming upside coupled by Commodity Channel Index growing higher than its zero line and heading towards 100 line.