Simple price action trading using s&r and reversal signals from the swing points. - page 8
You are missing trading opportunities:
- Free trading apps
- Over 8,000 signals for copying
- Economic news for exploring financial markets
Registration
Log in
You agree to website policy and terms of use
If you do not have an account, please register
very good
also eur/usd still greenOk sorry for being late...I will answers all of your questions but first tell me are you trading with real money or from the demo account?
Ok sorry for being late...I will answers all of your questions but first tell me are you trading with real money or from the demo account?
Are you trading real or demo?
no i still in demo from 1/2013 to now
I hope you remain active in this topic
and if you busy
may be you can choose one day in week to check and update this topic
Are you trading real or demo?
I am trading with real money
This is good
I want to tell you my story
I started to learn Forex since the beginning of this year
first i watch turtrial vidoes about support and resistant and reversal candel tick
and i was use reversal candel stick with support and resistant after watch this videos and i was gain profits (of course i was just training on forex basics)
after that i start Failure trip with forex i start search in forums on new strategies for more 6 months
but I got just one thing:
The deterioration of my health
i Become fat from 60kg to 85kg
So I decided to go back again to support and resistant and study it good and find strategy depend on just support and resistant and only higher time frames because I do not want to be nervous and open my pc every 5 min and .... etc
I hope that your strategy can be useful (I tried this way in trading as i told you when i was training and i know its good and thats the only way worked with me but i was don't know anything about money mangement and etc....)
because I'm really tired
anyway
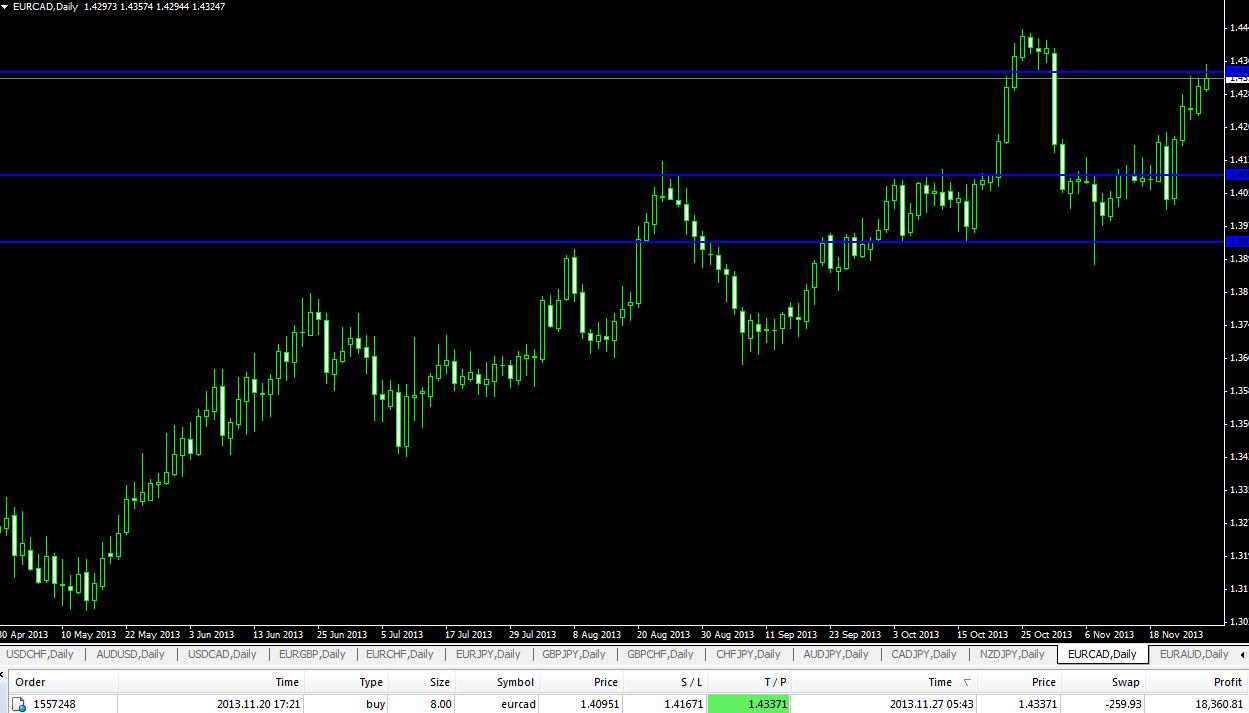
i took this trade (i know this support level not good)
but there is one problem i think risk ratio 1:1 is bad idea
how you can solve this problem
i took this too
Well after looking at your charts i can say your price action concepts are not clear.Go through the whole thread and then come back and ask questions if you have any.
Well after looking at your charts i can say your price action concepts are not clear.Go through the whole thread and then come back and ask questions if you have any.
yes but i have 3 questions:
1- what about risk 1:1?
2-how you can keep your eyes on all pairs + all this time frames 4H+8+12+d1+d2-etc?
3-How long have you been using this strategy?
Anyway
Anyway
I opened a demo account and I will start training on your strategy
Because I love it and I feel it's for me
This is interesting, I will test this with trade simulator in strategy tester to learn faster.
happy new year and i still here
its very good strategy
but there is 2 problem
1-thats hard to find chances on daily chart may be i waiting for 3 or 4 weeks for just 1 trade
but the real problem in risk 1:1
i meet person on facebook and he told me (you can draw s&r levels on daily and wait price action on 4 h)
i want to know if any one try that before?
price action trading
hello trader
the price action setup one of the most important forex straegy trading that is why i want to share some tips that i beleve it will help you improve your trading so let get this strat
what exactly is a false-break?
I thought you’d never ask! Joking, I know you are probably thinking that right now, so here you go…
A false-break can be defined as a ‘deception’ by the market; a test of a level that results in a break of that level but the market then retracts and does not sustain itself above or below that level. In other words, the market does not close outside of the level being tested; rather it leaves behind a false-break of it. These false-breaks are huge pieces of evidence for impending market direction, and we need to learn to use them to our advantage instead of becoming their victim.
Types of False Breaks
1. Classic Bull and Bear traps at key market levels
A bull or bar trap is typically a 1 to 4 bar pattern that is defined by a false-break of a key market level. These false-breaks occur after large directional moves and as a market approaches a key level. Most traders tend to think a level will break just because a market has approached it aggressively, they then buy or sell the breakout and then many times the market will ‘fake them out’ and form a bull or bear trap.
A bull trap forms after a move higher, the amateurs who were on the sidelines watching a recent strong move unfold cannot take the temptation anymore, and they jump in just above or at a key resistance level since they feel confident the market now has the momentum to break above it. The market then breaks slightly above the level and fills all breakout orders, and then falls lower as the big boys come in and push the market lower, leaving the amateurs ‘trapped’ in a losing long position.
2. False-break of consolidation
False breaks of consolidation or trading ranges are very common. It’s easy to fall into the trap of thinking a trading range is going to breakout, only to see it reverse back into the body of the range. The best way to avoid this trap is to simply wait until there is a clear close outside of the trading range on the daily chart, and then you can begin to look for price action trading signals in the direction of the breakout.
so if you master this for sure you will be able to counter the market
happy trading