FX FUSE | Key Levels and Market Forecasts
Eurusd
Confluence
The below are key figures that were determined from multiple layers of indicators at a price point. Bids are support, while offers are resistance:
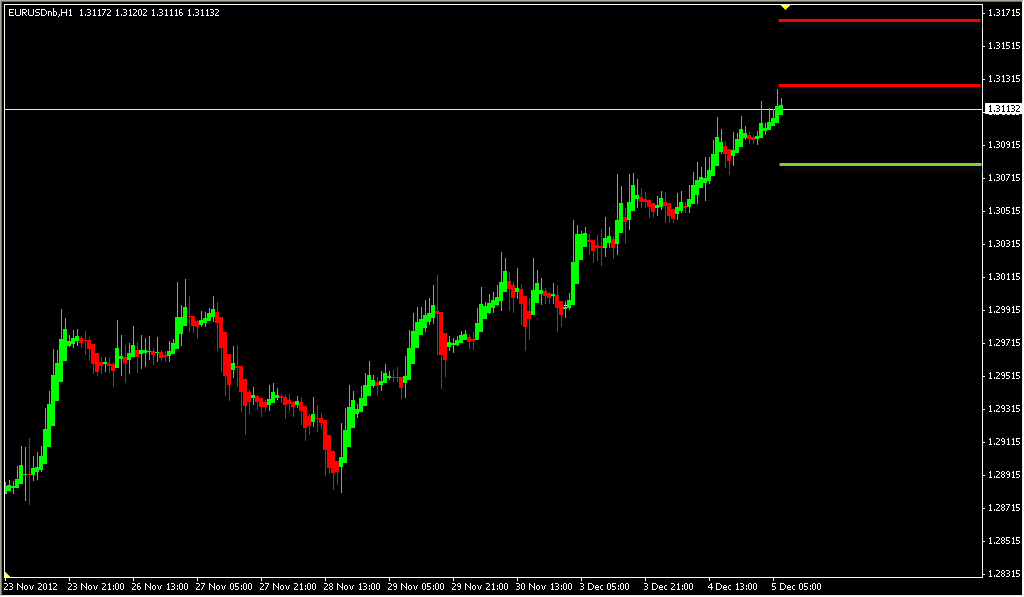
1.3170/80 - (Offers) DR3, WR3, W100EMA
1.3110/20 - (Offers) DR1, MR1, WR2, M100EMA, M20EMA
1.0380 - (Bids) DPV, WM5, 4H9EMA,
Strength
All of the below are measured in respect to the 1H9EMA:
DPV - Above
WPV - Above
MPV - Above
Daily 9EMA - Above
Daily 4H 9EMA - Above
Forecast
While we agree that there is a potential for a top here in the Euro, we would strongly suggest waiting to watch how price reacts at the first bid layer initially. Even if this level breaks, there is still tons of support underneath price that we will revisit if price begins to rollover. For now, 1.0380 is the number in focus.
We are cautiously bullish as you can see the 1.3110/20 level is just littered with resistance variables, although we still admit price has maintained its bullish momentum. The bottom line is that the EUR/USD is no longer on sale, and any positions long that weren't already accumulated under 1.3050 are probably dangerous and unnecessary from a risk to reward perspective.
#FXFUSE
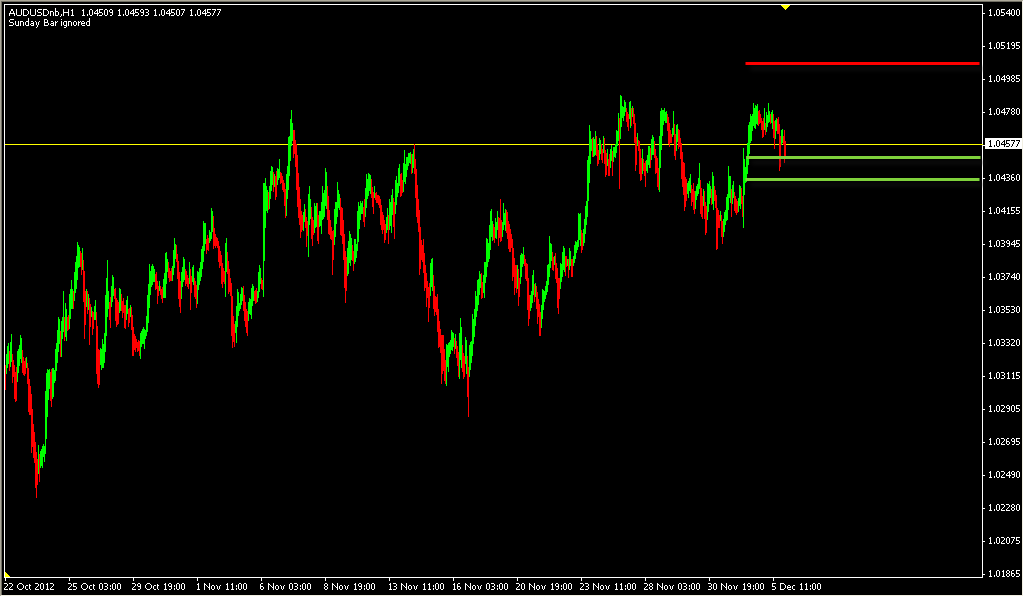
Our mentioned bid zones held in place and our stance remains the same on the AUD/USD until we are proven otherwise.
Here is a chart of how the market responded to yesterdays levels today:
#FXFUSE
Confluence
The below are key figures that were determined from multiple layers of indicators at a price point. Bids are support, while offers are resistance:
1.0453 - (Bids) DPV and 4H 9EMA
1.0440 - (Bids) WPV and Daily 9EMA
1.05-1.0516 - (Offers) DR1 and MR1
Strength
All of the below are measured in respect to the 1H 9EMA:
DPV - Above
WPV - Above
MPV - Above
Daily 9EMA - Above
Daily 4H 9EMA - Above
Forecast
With the RBA buzz around the market, AUD/USD stands to become a volatile pair. From a technical standpoint, we're looking for a move higher based off of the information above.
#FXFUSERisk Disclaimer
Forex trading involves substantial risk of loss. FX FUSE does not recommend trading beyond 1:10 leverage, trading for a living, or investing with unregulated, non-audited "trading professionals." Any gains advertised in Forex by "PIPS" is subject to interpretation since the value of a pip is determined by the trader. FX FUSE is not responsible for interpreting proper risk allocations for any individual or entity. FX FUSE, or any other related counter parties, is not licensed or intended to give trading advice. Past performance is not indicative of future results. FX FUSE covers education, systems, and trading technology on an opinion basis only, nothing more. FX FUSE is not responsible for any losses incurred by individuals or entities using it's services or materials for financial gains.
AUDUSD Results
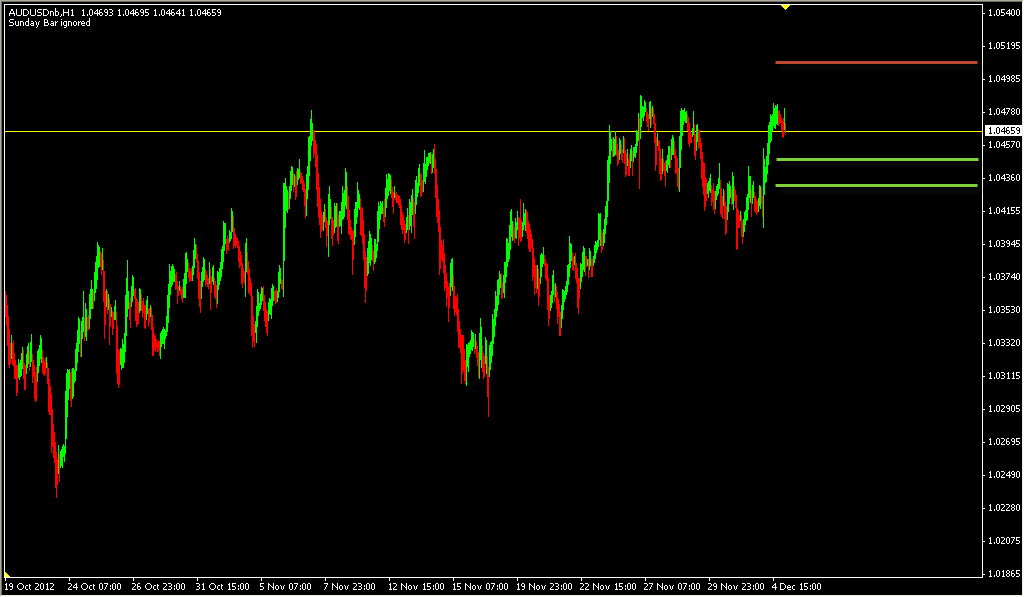
Our original posts on the AUD/USD long analysis are attached. Here's is an updated picture with the original levels still in place:

1.0453 - (Bids) DPV and 4H 9EMA
1.0440 - (Bids) WPV and Daily 9EMA TRIGGERED
1.05-1.0516 - (Offers) DR1 and MR1 TRIGGEREDPlease read our execution rules.
Total: +76 pipsPlease read our risk disclaimer.
#FXFUSE
Confluence
The below are key figures that were determined from multiple layers of indicators at a price point. Bids are support, while offers are resistance:
1.0453 - (Bids) DPV and 4H 9EMA
1.0440 - (Bids) WPV and Daily 9EMA
1.05-1.0516 - (Offers) DR1 and MR1
Strength
All of the below are measured in respect to the 1H 9EMA:
DPV - Above
WPV - Above
MPV - Above
Daily 9EMA - Above
Daily 4H 9EMA - Above
Forecast
With the RBA buzz around the market, AUD/USD stands to become a volatile pair. From a technical standpoint, we're looking for a move higher based off of the information above.
#FXFUSEOur mentioned bid zones held in place and our stance remains the same on the AUD/USD until we are proven otherwise.
Here is a chart of how the market responded to yesterdays levels today:
Gbpaud
 Confluence
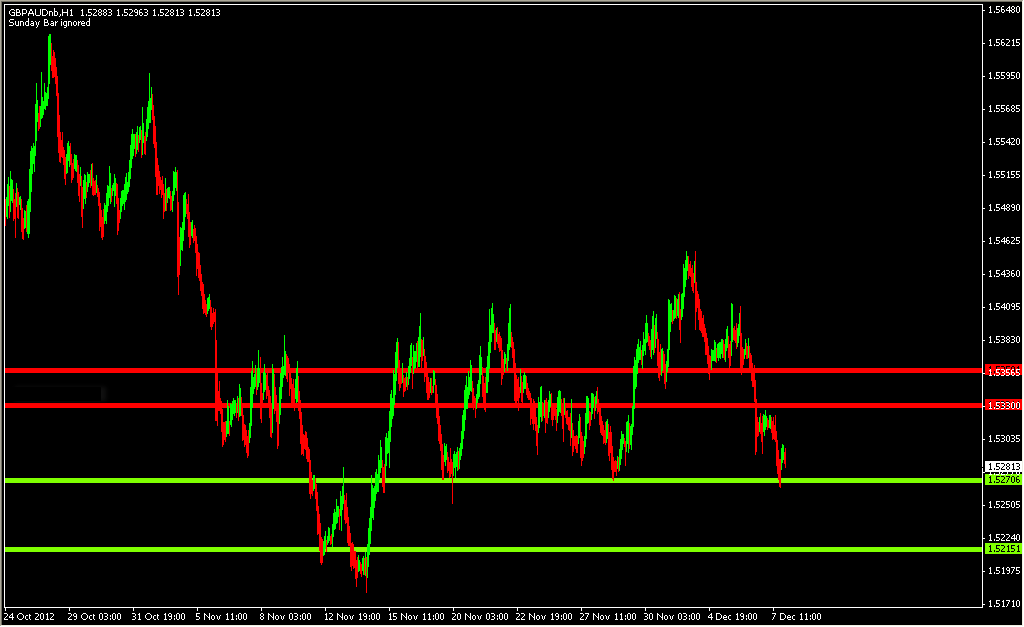
The below are key figures that were determined from multiple layers of indicators at a price point. Bids are support, while offers are resistance:
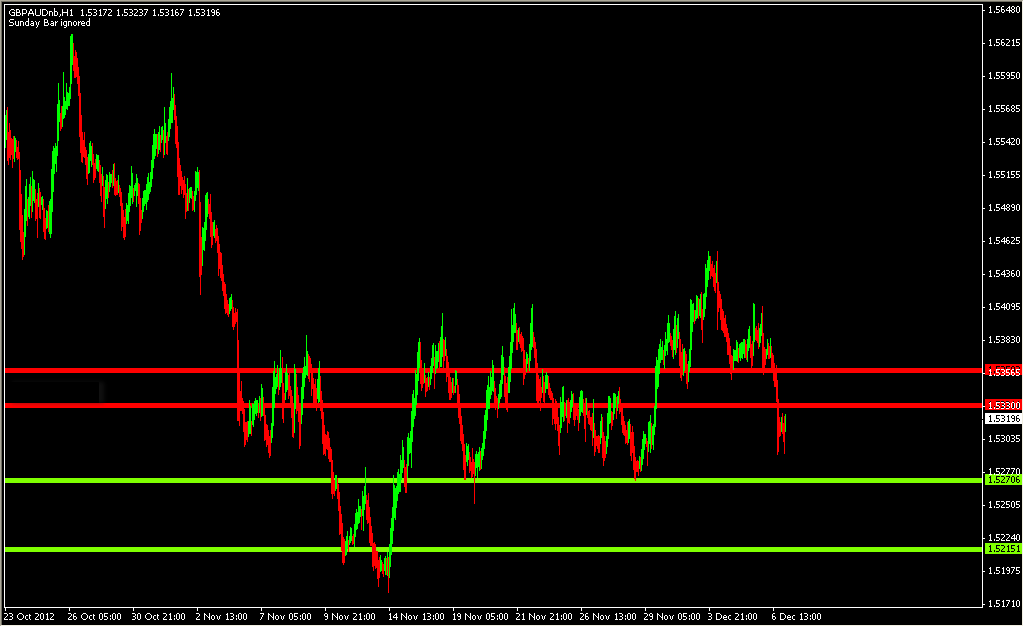
1.5356 - (Offers) DMR1, 4H9EMA, D9EMA
1.5335 - (Offers) WPV, DPV, 4H9EMA
1.5270 - (Bids) WS1, DS1, MM3
1.5215 - (Bids) WS2, DS2
Please read our execution rules.
Strength
All of the below are measured in respect to the 1H9EMA:
DPV - Below
WPV - Below
MPV - Below
Daily 9EMA - Below
Daily 4H 9EMA - Below
Forecast
The pound crosses took a hard hit today and based on the information above, combined with a look at the daily charts, we are seeing the odds favoring a continuation to the downside. These opinions will quickly unravel if price breaks the 1.5356 offer barrier.
Please read our risk disclaimer.
#FXFUSE
EURUSD Forecast
 Confluence
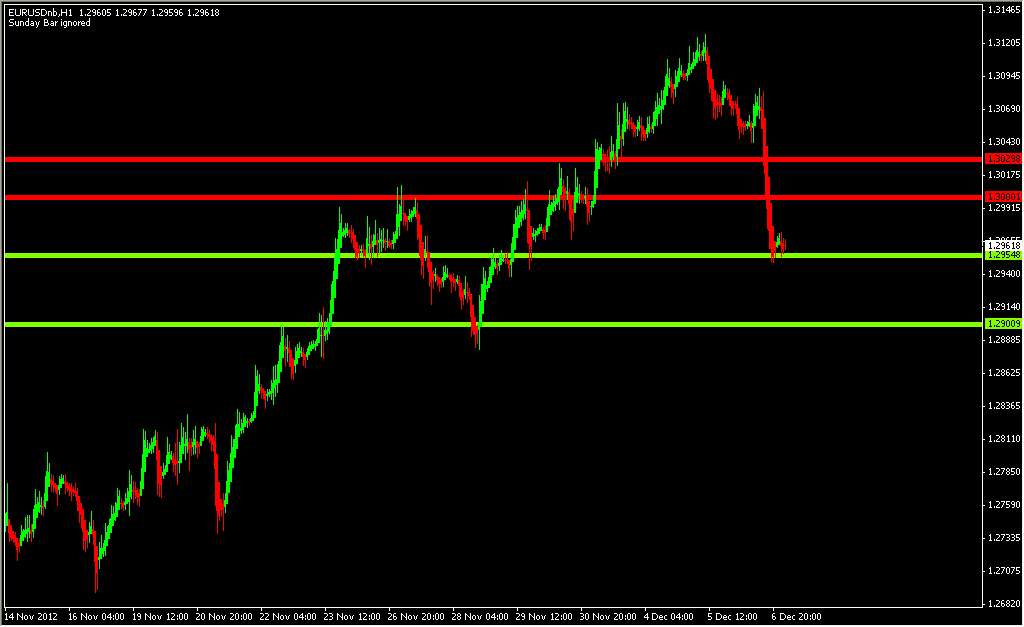
The below are key figures that were determined from multiple layers of indicators at a price point. Bids are support, while offers are resistance:
1.3030 - (Offers) DMR1, 4H9EMA
1.3000 - (Offers) DPV, D9EMA,
1.2960 - (Bids) WPV, DMS1, M50EMA
1.2900 - (Bids) MPV, WS1, M9EMA, W9EMA
Please read our execution rules.
Strength
All of the below are measured in respect to the 1H9EMA:
DPV - Below
WPV - Above
MPV - Above
Daily 9EMA - Below
Daily 4H 9EMA - Below
Forecast
The last time we took a look at this pair, we were cautiously bullish with a stand-by approach focusing on the 1.0380 level, which has clearly broke. We lean for more downside, but we believe there are cleaner opportunities in the market, so we aren't interested in trading this pair. Nevertheless, the bid and offer zones above are valid, and this pair will not have much momentum to the upside until it clears 1.3030. We noticed a fairly large confluence cluster at about 1.2900, so that could easily be a magnet on the downside, but also a zone for a decent potential bounce.
Please read our risk disclaimer.
#FXFUSE
Confluence
The below are key figures that were determined from multiple layers of indicators at a price point. Bids are support, while offers are resistance:
1.3170/80 - (Offers) DR3, WR3, W100EMA
1.3110/20 - (Offers) DR1, MR1, WR2, M100EMA, M20EMA
1.0380 - (Bids) DPV, WM5, 4H9EMA,
Strength
All of the below are measured in respect to the 1H9EMA:
DPV - Above
WPV - Above
MPV - Above
Daily 9EMA - Above
Daily 4H 9EMA - Above
Forecast
While we agree that there is a potential for a top here in the Euro, we would strongly suggest waiting to watch how price reacts at the first bid layer initially. Even if this level breaks, there is still tons of support underneath price that we will revisit if price begins to rollover. For now, 1.0380 is the number in focus.
We are cautiously bullish as you can see the 1.3110/20 level is just littered with resistance variables, although we still admit price has maintained its bullish momentum. The bottom line is that the EUR/USD is no longer on sale, and any positions long that weren't already accumulated under 1.3050 are probably dangerous and unnecessary from a risk to reward perspective.
#FXFUSEGBPAUD Review
Our mentioned offer zones held in place and our stance remains the same on the GBP/AUD until we are proven otherwise. The trade is considered open, and currently at break even according to our execution rules. We are looking for the 1.5215 level now until noted otherwise.
Here is a chart of how the market responded to yesterdays levels today:
#FXFUSE
Confluence
The below are key figures that were determined from multiple layers of indicators at a price point. Bids are support, while offers are resistance:
1.5356 - (Offers) DMR1, 4H9EMA, D9EMA
1.5335 - (Offers) WPV, DPV, 4H9EMA
1.5270 - (Bids) WS1, DS1, MM3
1.5215 - (Bids) WS2, DS2
Please read our execution rules.
Strength
All of the below are measured in respect to the 1H9EMA:
DPV - Below
WPV - Below
MPV - Below
Daily 9EMA - Below
Daily 4H 9EMA - Below
Forecast
The pound crosses took a hard hit today and based on the information above, combined with a look at the daily charts, we are seeing the odds favoring a continuation to the downside. These opinions will quickly unravel if price breaks the 1.5356 offer barrier.
Please read our risk disclaimer.
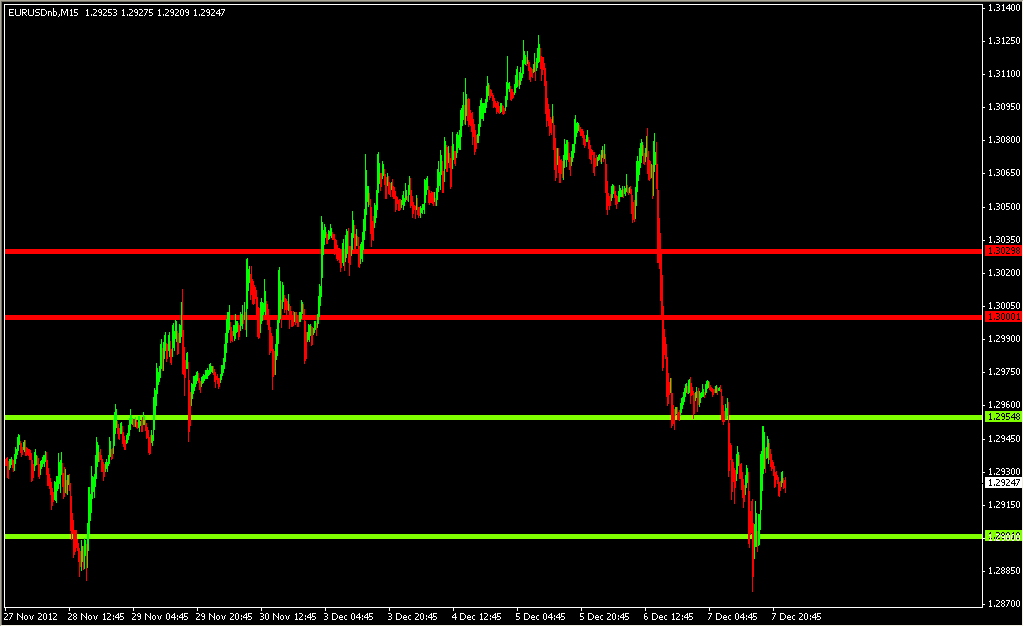
#FXFUSEEURUSD Review
Our mentioned zones proved valid and our stance remains the same on the EUR/USD until we are proven otherwise. However, we didn't suggest a trade on this pair.
Here is a chart of how the market responded to yesterdays levels today:
#FXFUSE
Confluence
The below are key figures that were determined from multiple layers of indicators at a price point. Bids are support, while offers are resistance:
1.3030 - (Offers) DMR1, 4H9EMA
1.3000 - (Offers) DPV, D9EMA,
1.2960 - (Bids) WPV, DMS1, M50EMA
1.2900 - (Bids) MPV, WS1, M9EMA, W9EMA
Please read our execution rules.
Strength
All of the below are measured in respect to the 1H9EMA:
DPV - Below
WPV - Above
MPV - Above
Daily 9EMA - Below
Daily 4H 9EMA - Below
Forecast
The last time we took a look at this pair, we were cautiously bullish with a stand-by approach focusing on the 1.0380 level, which has clearly broke. We lean for more downside, but we believe there are cleaner opportunities in the market, so we aren't interested in trading this pair. Nevertheless, the bid and offer zones above are valid, and this pair will not have much momentum to the upside until it clears 1.3030. We noticed a fairly large confluence cluster at about 1.2900, so that could easily be a magnet on the downside, but also a zone for a decent potential bounce.
Please read our risk disclaimer.
#FXFUSEDefault Execution Rules
All trade results shown are based on our lowest bid zone triggered, to our highest offer zone triggered (longs), or vice versa from our highest offer zone triggered, to our lowest bid zone triggered (shorts). This is the case unless the trade is announced otherwise. All bid levels are valid stop loss levels (longs), and all offer levels are valid stop loss levels (shorts), and will only be stopped out if there is a 15 minute Heikin Ashi Candlestick close into the said level. The outermost bid or offer zone will always be used for the stop. Trades go break even at the first offer zone, after triggering, when going long, and trades go break even at the first bid zone, after triggering, when going short. This is the case unless the trade is announced otherwise. A break even trade also won't trigger unless there is a 15 minute Hiekin Ashi Candlestick close into the original execution level. In the event an offer or bid zone mentioned is already sitting at a level when our forecast is released, a trade will also be considered triggered short if it drops through the bid on a 15 minute Heikin Ashi Candlestick close, or long if it rises through the offer on a 15 minute Heikin Ashi Candlestick close. In the event this happens, the price must then retrace to cover the spread before executing, if it reaches it's next bid or offer zone before this happens, the trade is void. The outermost level won't be used for the stop anymore in this case, but instead the actual execution level if a 15 minute Hiekin Ashi Candlestick closes back into the zone. All take profit and entry levels are allowed -5/+5 price interest point flexibility due to discrepancies between platforms, spreads, and other market inefficiencies. All take profit and entry levels are also allowed the -5/+5 price interest point flexibility between what is written out on in the forum, and the number that shows up on the line that is shown in the charts. If you have any questions about these rules, please post them in the forum. They will be answered.
The above rules are valid unless otherwise noted in the forecasts.
Execution Disclaimer: If some of these rules seem too flexible for your taste, too confusing, or non-applicable to your trading... then please stop using my free, and high quality, trading material.
Common FAQs:
Question) What's up with the -5/+5 rules? Seems like you're giving yourself the benefit of the doubt on a lot of "calls."
Answer) That's because I am. The reason this is done, from a technical standpoint, has already been explained. Then at times, I'm slightly off on a level in the writing, versus the chart, and vice versa. The other reason there is a lot of flexibility here is because I'm busy trading, and my execution methods and levels can vary "on the fly" as the market progresses. My systems and trading style rarely relies on a "set and forget" methodology. My trading revolves around flexible trading scripts, order cancels orders, and so forth. The reality is, the people I am looking to assist are not interested unless there is some sort of quantifiable performance. Think "lights, cameras, action." That's exactly the reason this is done the way that it is. It's my opinion that most people get slaughtered (stop hunts, missed fills etc.) playing the market with traditional execution techniques. If you feel you can be profitable long term from manually placing trade signals in your account from a signal provider, you have something coming to you. You will, however, be profitable long term with a helpful forecasting guide that enables you to make trading decisions on your own. I'm trying to put out this quality, and helpful material, that forces the trader to think for themselves, while at the same time showing some sort of performance.
GBPAUD Review
Our mentioned offer zones held in place and our stance remains the same on the GBP/AUD until we are proven otherwise. The trade is considered open, and currently at break even according to our execution rules. However, the trade is nearing a break even stop out trigger, please refer to the execution rules.
Here is a chart of how the market responded to yesterdays levels today:
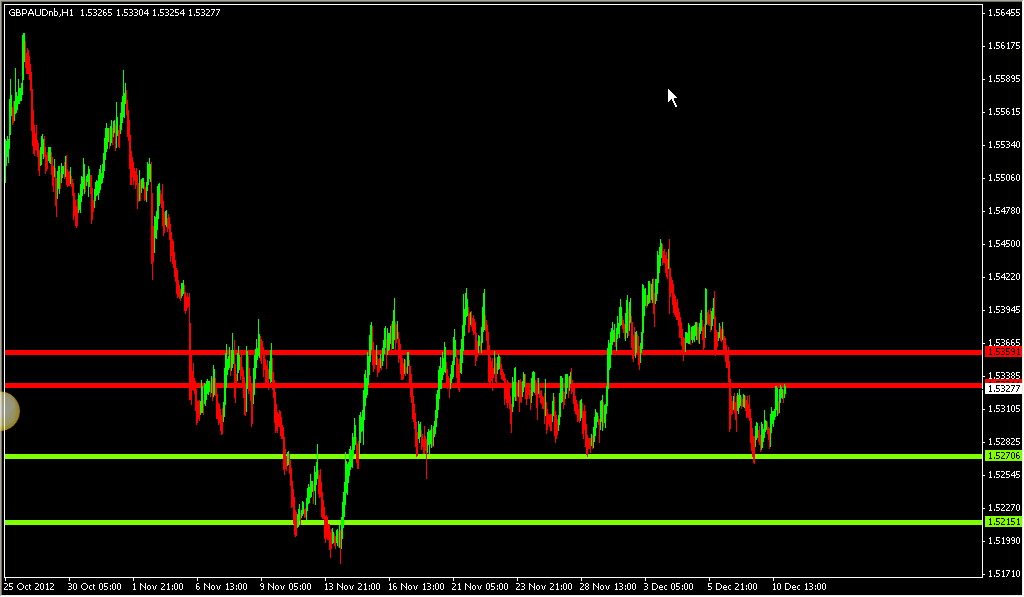
Our mentioned offer zones held in place and our stance remains the same on the GBP/AUD until we are proven otherwise. The trade is considered open, and currently at break even according to our execution rules. We are looking for the 1.5215 level now until noted otherwise.
Here is a chart of how the market responded to yesterdays levels today:
- Free trading apps
- Over 8,000 signals for copying
- Economic news for exploring financial markets
You agree to website policy and terms of use
Confluence
The below are key figures that were determined from multiple layers of indicators at a price point. Bids are support, while offers are resistance:
1.0453 - (Bids) DPV and 4H 9EMA
1.0440 - (Bids) WPV and Daily 9EMA
1.05-1.0516 - (Offers) DR1 and MR1
Strength
All of the below are measured in respect to the 1H 9EMA:
DPV - Above
WPV - Above
MPV - Above
Daily 9EMA - Above
Daily 4H 9EMA - Above
Forecast
With the RBA buzz around the market, AUD/USD stands to become a volatile pair. From a technical standpoint, we're looking for a move higher based off of the information above.
#FXFUSE