Advanced trading lessons - page 26
You are missing trading opportunities:
- Free trading apps
- Over 8,000 signals for copying
- Economic news for exploring financial markets
Registration
Log in
You agree to website policy and terms of use
If you do not have an account, please register
ok no more questions i gues
remember i am an old channel trader.
so i will go into the scale with channel shifts the answers we want to know are:
1. after a trend candle closes in the best probability will the next one be trend candle
to fallow?
2. this help us with regard to targets.
3. this help us with regards to entry after a trending candle close( do we take the next one) ?
instead of the preview document i want to start with a drawing it will be more clear before i go to
a chart, we go to a chart later.
so i will start drawing an example chart tonight .
philt
this all can seem confusing, but this is not back history even though back history is shown in the examples.
every thing in my examples dose have to have two points so far established in the market first before an entry
decision.
the trading opportunities are:
1. the emotional point slight crossing at the third point.
2. a first time physical strike of a upper time frame trend line.
3. a data transfer point with over lays.
4. a high two traps in a range( down trend), or low two traps in a ( up trends range)
5. or counter trend entries on large scales pull backs.
6. what we have not covered yet price action.
it took me a long time to ketch some things right side, the honest truth is i use to get upset when
i was not paying attention to an opportunity right in front of me.
i started out as demo trader only. risking between 25 to 40 pips per trade as a rule. after it seemed
like a long time months my results were amazing and then i felt as if my account would be huge
by now if i just went in live! so i felt hurt that i traded for so long so unbelievably well and did not
really have anything to show for it.
on top of all of this i am raising three boys working and have to pay attention to the wife.
on top of all that work keeps pushing me for taking a management job, that i do not want.
on top of that i am fixing up an old house. on top of that i am teaching a friend to trade.
do i trade live yes i have been for only 3 months now. but my time is very limited so i have
only taken 12 trades in that time and i went 10 - for 12 possessive. that's the truth.
i probably have a long ways before really calling my self a pro. with rearguards to live trading.
at the same token i have taken 5.000.00 demo to 100,000.00 and more at least 3 times.
with the same resultants.
and studied and did research for 7 years plus.
there you go that's my story. if every one thinks i do not have any value to teach this, you can
give me the bird now.
one channel shift
trading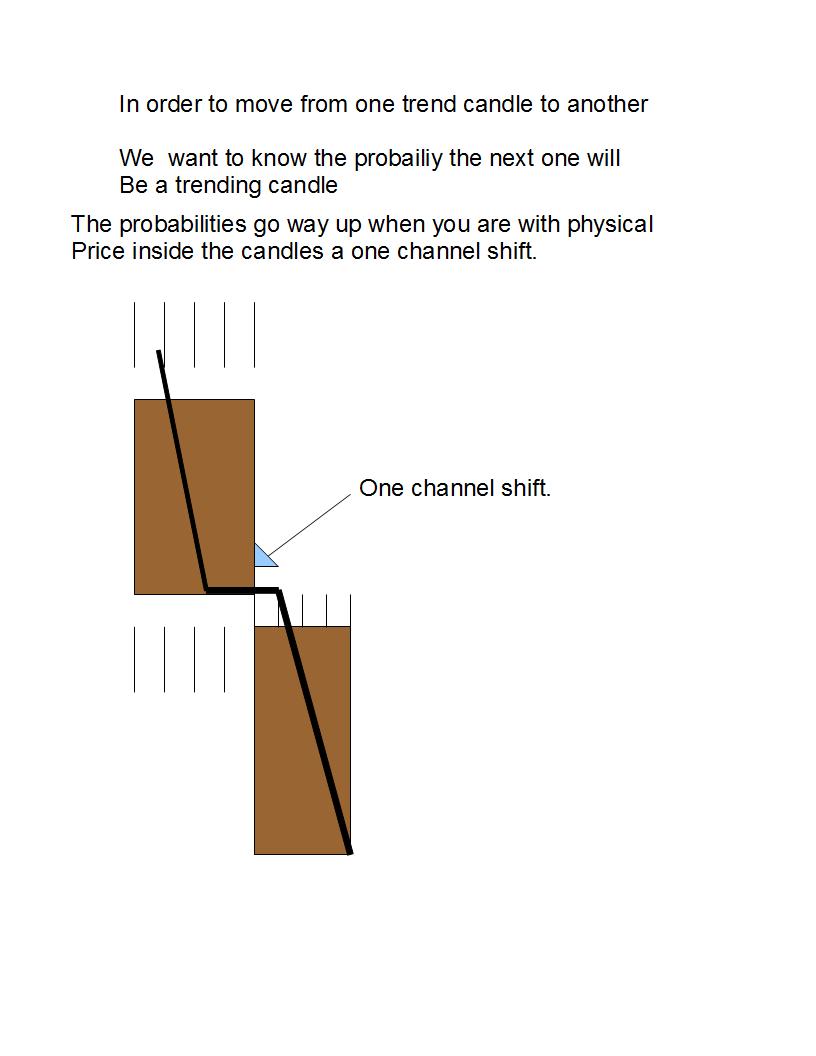 the one channel shift
how do you know?
how do you know this will be a two channel move! probability. probability of containment of the trend line,
and containment of time left in the upper time frame scale, the slop of that scale , experience comes from
back testing these. also paying attention to the traps.
remember also the market like to either leave before reaching a trend line or after crossing it.
so by mapping probability you can get on trades like this.

as far as target goes
as far as targets go the dark black lines are the beginning and ending of the month,
Pandora's box -- the probability of the new monthly open will most likely take all your profit on the trade
so mapping your self in time frames is good business!
remember almost all candles over lap to some degree except gaping candles. monthly candle do not gap to
the point of no over lap.
Bow thank you for replies and taking the time to show us.. I personally can't see how you would trade this but it's just an opinion.
Keep posting with it and we'll see how your trades go. Good luck with the trading and the future..
philt
thank you and good luck to you also.
there is more to price action
there is more to the price action section. but lets rest a moment here.
what we have essentially done here is: mapped ourselves in the market trend.
we have identified a relation ship that occurs between upper time frame trend lines and physical price.
we have identified market tricks (traps) (trend line third point)
we also learned a little market psychology.
we also learned about time. how time frame candles overlap almost always except gaps.
we also have our range tail sheet.
we talked about advertised closes.
we also learned the high two traps.
we also talked about containment with in trend line.
we also talked about indicators and how when ticks slow down the drama is as great or greater then momentum
swings.
now we are learning to look at market noise inside candles and matching it up with probabilities in relation
to that candles noise.
all this learning is designed to track the market in manner in which a trader can identify:
#1 entries possibilities! and entry probabilities!
#2 understand how the shifts work with inner and out slopes.
#3 to be able to stay out of trouble.
but before we go further i wanted to say when you read and learn this stuff it makes a trader much
more aware of the truth of the market for the first time for most traders.
so unlearning all the things traders learned and studied about the markets before, is a process of digestion.
the only way to do that is take the information and start back testing it yourself for confirmation.
to back test back history you have to find a point in the market and work with trend lines realistically
right side.
one of the biggest benefits traders should also receive here by the time we are done is: the ability to trade
with a plan that fits the markets habits, by focusing on what is important.
remember
remember when i said the market time frame can skip crossing more then one time frame trend line
in a range.
well turns out that this is impotent also.
this is one of the market psychology tricks. this happens all the time. lets take a look at it.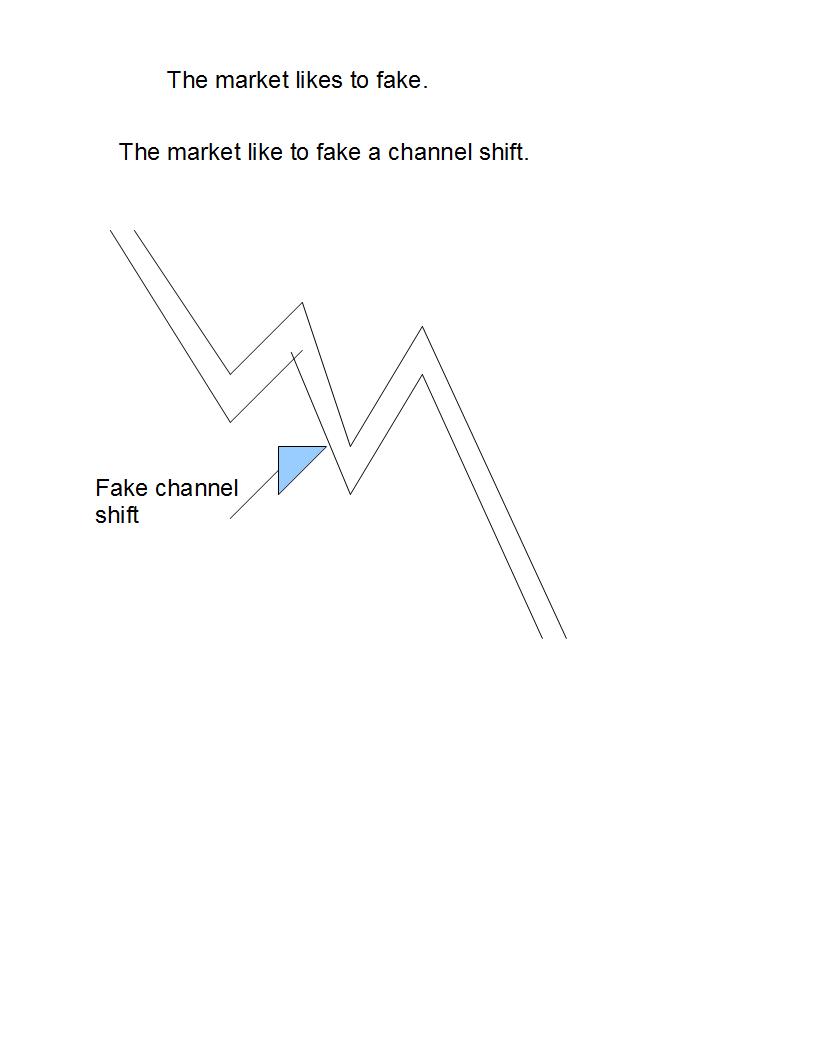
now
now this is just the first shot.
notice in this shot momentum started in position 1 on both candles, this is an indication
of a channel shift trap, because the timing was the same.
after this shot we look at it again and talk about the third point slightly crossing the trend line.