FXEmpire's Daily FX analysis
EUR/USD Nov. 2nd
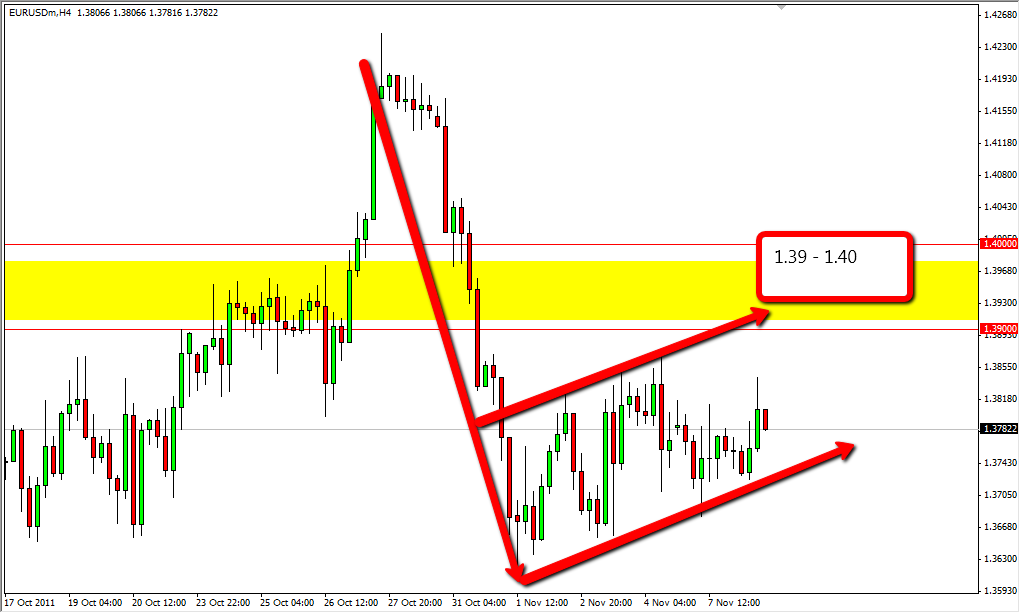
It looks like the EUR/USD might be getting a bit of a relief rally during the session, which when you look at the recent fall isn't a big surprise. Also, with the Fed meeting and statement coming out during the session, the market may be waiting for some kind of signal that QE3 is on the table. With this in mind, many traders are dumping the USD. However, with the issues in Europe - we believe this will be short-lived. The massive fall is predicated on bad news out of the EU, which happens quite frequently now. The fact that it is a "sell first and ask questions later" type of pair suggests to us that the fear is still palpable.
Looking at the charts, we have a 100 pip zone between 1.39 and 1.40 as a major inflection or pivot point in this pair. It has historically been both support and resistance, so we feel that the area could produce a set up to short the Euro. We will wait to se bearish price action in this area before selling. This is also predicated on the fact that the Euro can't even gain on the Franc - a currency that is being worked against by it's own central bank! To us, this shows weak underlying strength in the Euro overall, and we are currently waiting to see if a short position arises.

USD/JPY Nov. 4th
It appears that the closest thing to an easy trade at the moment - if there is such thing as an easy trade in Forex - is to short the USD/JPY. We have seen another intervention, and this move could not get above the all-important 80 handle. This is the second time that the Bank of Japan has failed to clear the hurdle. In fact, one could say that the 80 mark is the "flip" of the pair. Until we close above that area, we cannot suggest buying as it is massive resistance. (BoJ can't break it - neither can you!)
Unilateral interventions usually don't work. The most recent one before this week only took about 5 days to fail, and we suspect this will be the case again. It could be a slow and ugly grind, but the market clearly has no real interest in going higher at this point. We look at this as an intermediate position - as if the pair gets too low, this will happen again in our minds, but we might as well take the 100 pip or so that it should drift down.

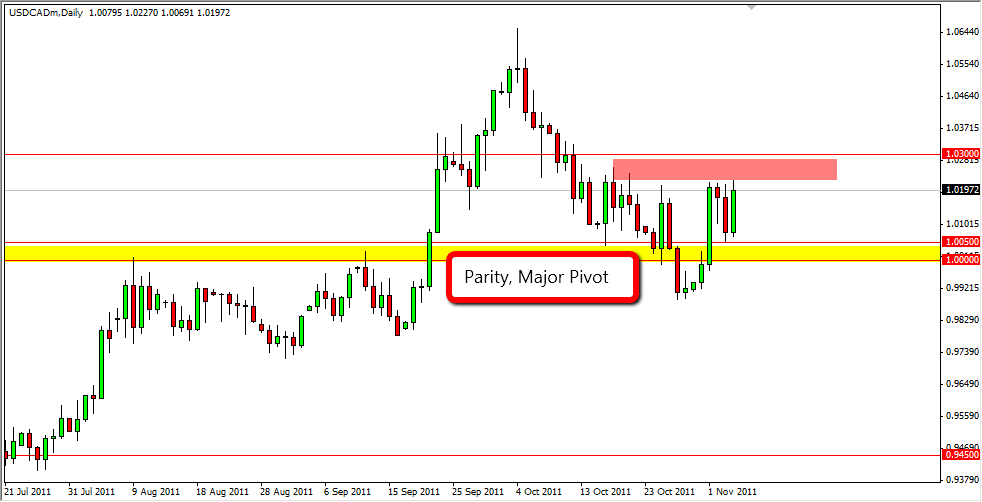
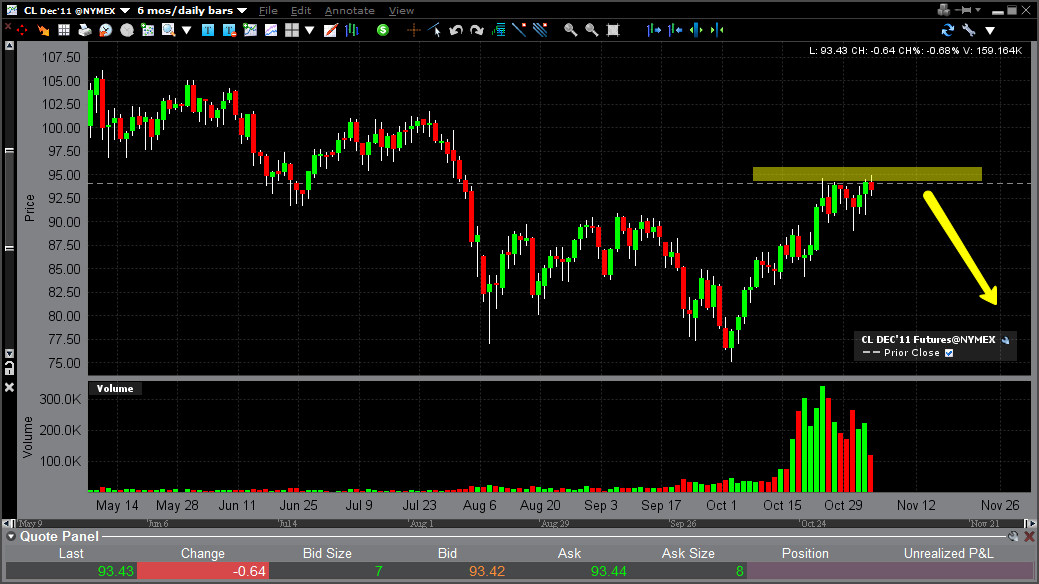
USD/CAD November 7th
Looking ahead to the next week, the USD/CAD pair has caught our eye as a study in correlations. The price of oil markets can greatly move the pair, as the Canadians export so much crude to the USA. The Light Sweet Crude futures are currently struggling at the $95 mark, which has been resistance before. If the oil markets fall, and the headline risks keep coming, this pair could move higher. However, it should be noted that the area above, and going to 1.03 is resistive. It is because of this we are favoring longs - but only after 1.03 is cleared on a daily close. We don't like selling at this point, as the parity level should continue to cause reactions.
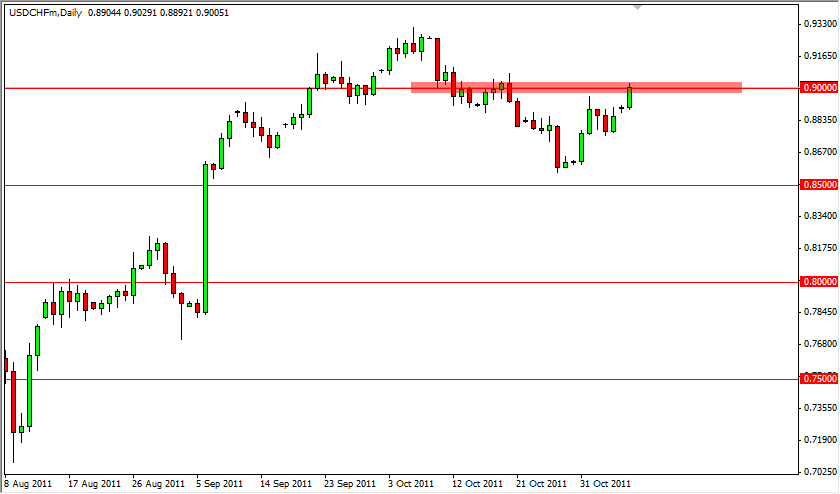
USD/CHF November 8th
Looking at the USD/CHF pair, we had a push during the Monday session to the all-important 0.9000 level. Knowing that the area has served as both support and resistance in the recent past - we have begun to take notice in this pair. The SNB's Jordan made comments that the central bank was willing to do what it takes to weaken the Franc. This caused a knee-jerk reaction that we have some reservations about. (It was even more pronounced in the EUR/CHF pair.)
The USD/CHF is a better of two choices though, when talking about the EUR/CHF. With all of the problems in Europe, it would be a real stretch to consider owning the Euro for any real length of time. The EFSF had what could be called a failed auction today, and this is a bad sign in our eyes. The USD is a safe haven currencies, so bad news could also push this pair higher - and let's be honest.....there is plenty of that to go around.
EUR/USD November 9th
The EUR/USD continued to defy gravity for the Tuesday session, but looking ahead, we can see a few technical headwinds in this pair going forward. Italian bond rates are rising, and with the uncertainty in the Italian government, things could rapidly shift. In fact, the EUR/USD is probably one of the riskiest pairs to trade at the moment, but since so many people want to - we feature it.
Once we get toward the 1.39 to 1.40 area, there is a massive area for sellers to step in. Of course, we have seen a pullback during the midday in N. America in reaction to some key votes in Rome. Looking at the chart - do we have a flag? Only time will tell, but one would have to think that the most likely path for the Euro over time is down.....
Attached is the 4 hour chart for the EUR/USD pair.
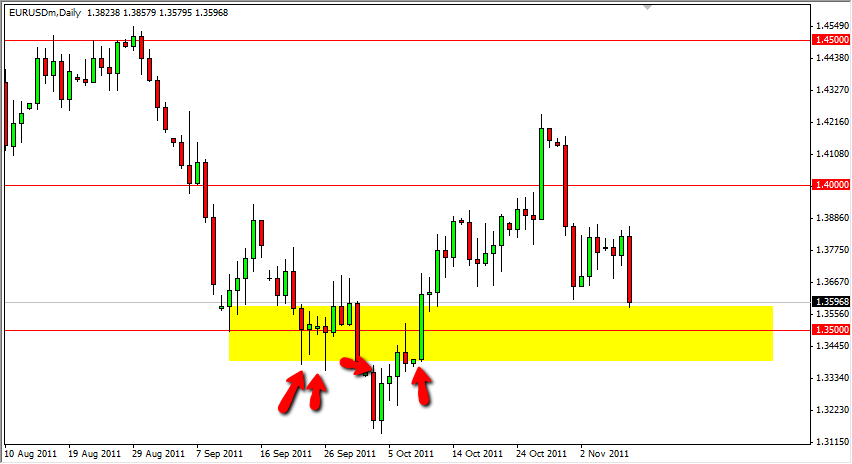
Looking at EUR/USD into the Nov. 10th session.
Looking at the EUR/USD, you can see in early morning US trading the pair has slammed back down towards the 1.36 level as Italian bonds sell off. We have entered a new period where Italian bonds simply will not be sustainable at this point, and the spread on the Italian vs. German 10 year has reached over 5%. This is very bearish for the Euro, but the charts are telling us that the move down from here will be tough. Not impossible - but certainly tougher than the first move during the European session.
Looking at the box on the chart, you can see several different areas that show support from 1.36 down to 1.34. We think this area will hold the key to future moves in this pair. The area is going to be where we look for candles to suggest the direction, but the truth is that we cannot "guess" the direction - we are going to react to it.
The move will more than likely be brutal, and obvious. Just the way we like our signals.
Nzd/usd
Looking at the Kiwi Dollar during the US session, we see that the 0.78 handle is being broke though, and this makes sense with the currency being so sensitive to global risk. The headlines are a real danger to risk appetite, and as such we like the idea of selling this pair as the USD is the de facto safe haven at this point in time.(Switzerland and Japan are both fighting this title.)
If we clear the 0.7750 level, it looks as if we will try to make a run back down to 0.75, which we see as the next major support area. While the Aussie is another favorite to short during the weaker moment of risk appetite, the Kiwi seems to have a cleaner path downward at the moment.

Continuing w/ the Kiwi.....
Taking a look at the NZD against many other pairs, there is an obvious "big figure" against the Yen at the 60 handle. The pair is notoriously risk-sensitive, and as the world seems to have been saved (for the 300th time this month) on Friday, it makes sense this pair could rise. Either way, this is the exact kind of chart we like: Obvious. If the 60 level gets broken through - it simply means a reversal of the position. These big numbers attract a lot of trading, and as such tend to dictate the future direction.

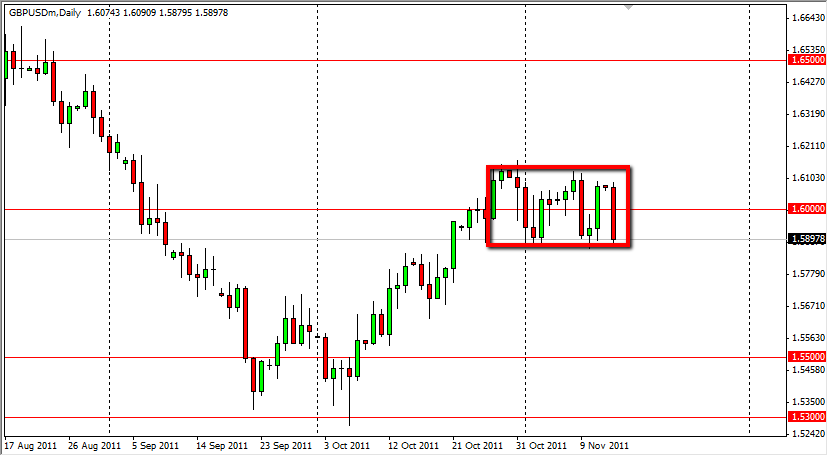
British Pound falls to test "line in the sand".
Looking at the cable pair, it is clear to see that the 1.60 area has been like a magnet recently. The markets like these large round numbers, and with the uncertainty out there in the global markets, one has to wonder whether or not there is much volume. (Remember, any "volume" on a platform for trading Forex is tick volume at your broker, nothing more.)
Because of this, the GBP/USD chart has caught our attention this afternoon. It looks as if it is testing the bottom of the recent consolidation, and sets up for a fairly simple trade. If we break lower than the recent lows in the 1.5875 area, we should find this pair falling. If we don't - 1.61 is probably going to be tested again as we consolidate even more.
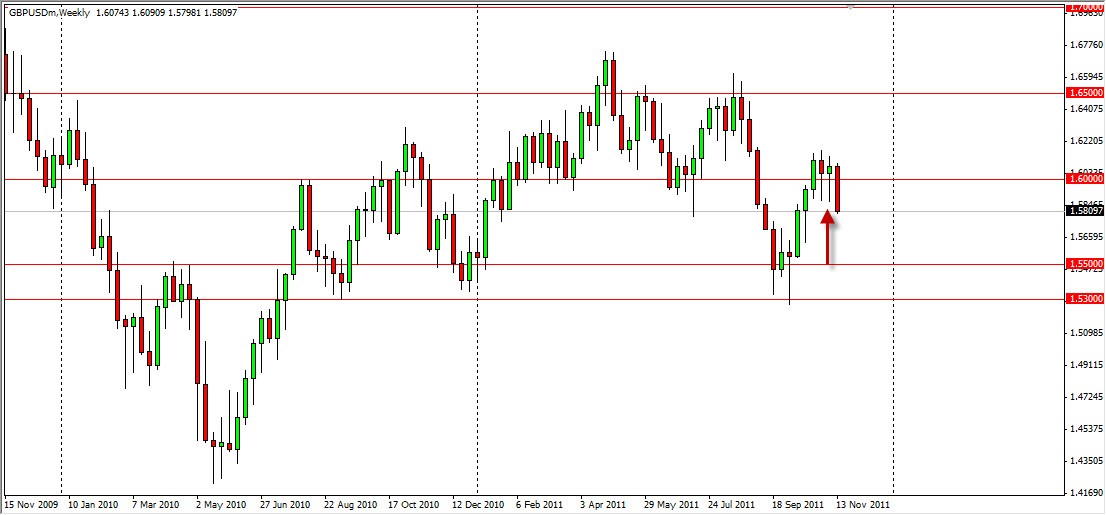
British Pound falling......and should continue to.
Looking at the GBP/USD pair, it is obvious that the momentum has shifted to the downside. The breaking of the two previous week's hammers to the downside is a very bearish signal. This doesn't happen everyday, and as such we are very bearish of the Pound now.
- Free trading apps
- Over 8,000 signals for copying
- Economic news for exploring financial markets
You agree to website policy and terms of use
FX Empire provides analysis and information to FX traders globally. In this thread, the firm will post free analysis to guide traders in what we see as potentially interesting set up in the FX markets. Most, but not all, analysis will focus on the daily charts.