Another method is to entering the position when the currency pairs cross and we are exiting when there is a gap between these currency pairs.
In reviewing your system I have noticed that there is a diffrence between the price scales of the traded currencies. If the Eur/Usd is winning against the Gbp/Usd, when they eventually cross the trade could possibly (depending on the distance in the gap when first traded) be negative as the Gbp/Usd has moved a greater distance across the chart in comparison to the Eur/Usd. If the Gbp/Usd is the winning trade then the potential profit could be greater than the intial gap on entry. There MUST be a big gap on entry.
Dreamliner,
Interesting strategy. Do you know of any place where we can get a correlation table for every timeframe? I know how to calculate it, but it would be handy to have it available.
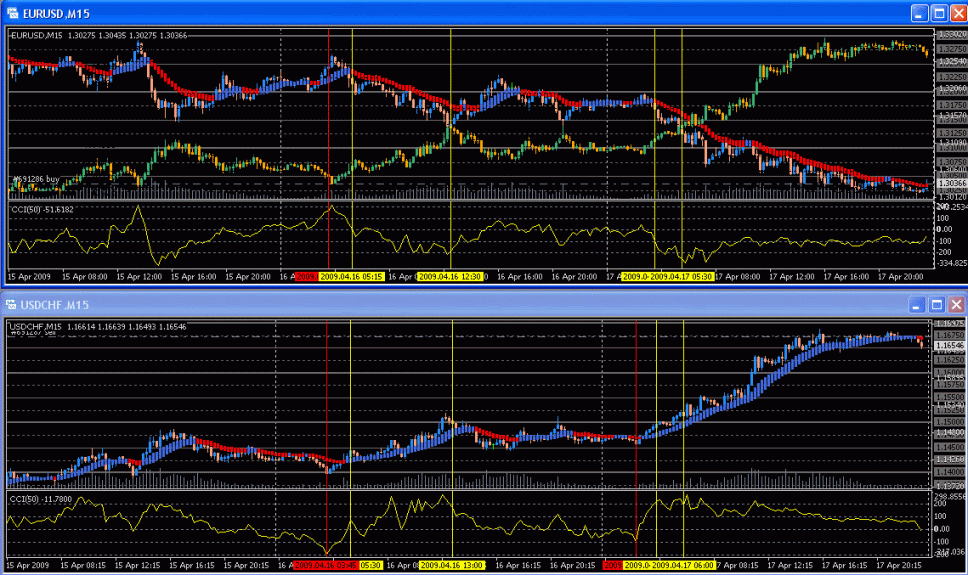
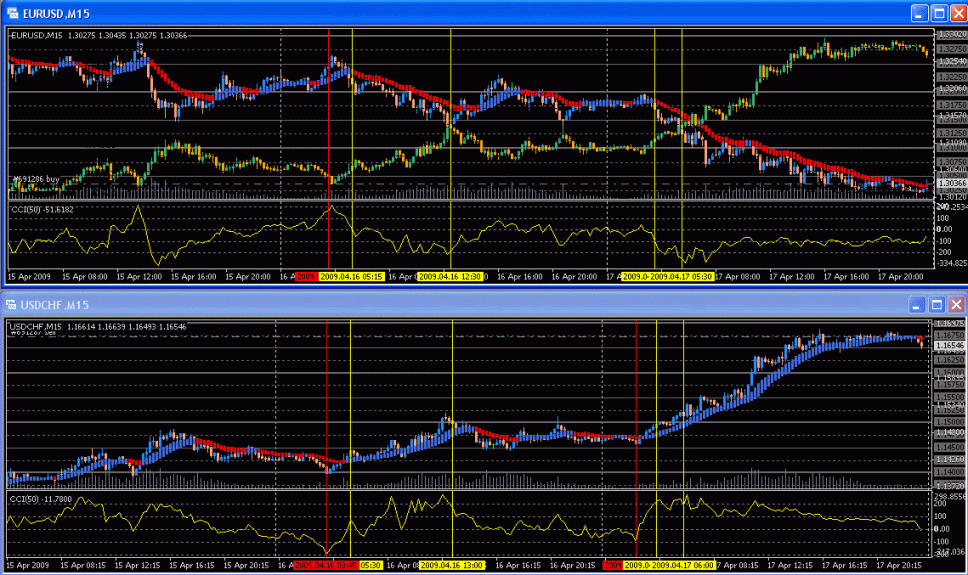
I would also like to know how long you have been trading that strategy and what are your results so far? What I find difficult is to find the best moment to enter a trade. I sent a picture of what I think could be used for that. For the EURUSD and USDCHF pair couple (also EURAUD/AUDCHF and EURGBP/GBPCHF), we could wait for a divergence and then for an oscillator like CCI to reach overbought/oversold zones (see red vertivcal lines on the pic). From there, you know there is a probability that price of the two pairs will converge together. Then use an indicator like Heiken Ashi to confirm the convergence and exit when either one of the Heiken Ashi changes color or at the cross of the two pairs.
In my example, I entered my trades from the Heiken Ashi signals only, but it would be better if an oscillator can be used as an alert prior to entries.
My 2 cents.
Regards.
Chamane

chamane,
yes there is, check out this link for correlation tables:
I tried that strategy above by waiting for gaps and buying the bottom pair and selling the upper pair and i really liked its concept but it need some adjustments as far as what pairs to trades and what is the critiria. so far this is what i observed:
1-the order of pairs changes with differnt time frames so on the 1 min one pair could be the top and on the 15 min, same pair could be at the bottom, so its confusing who is up or down, but i used the 1 min so far.
1- using the 1 min, watch for spreads at the time of entry, i noticed FXCM spreads increases spoiling my entry.
2- the pairs dont move the same number of pips, so sometime i find myself at even or a lose even after the pair touches. if you are on the wrong side of the stronger pair, you will lose.
3- sometimes the gap just keep getting wider and wider and if you have the wrong pairs you could lose lots of pips.
4- once you are in a trade, you dont how how long it will take before the pair closes again, this could take mins or long hours, and you have to be infront of the pc to close manualy.
but again, i liked it so much because it is systematic and dont require forcasting trends, but it still need some work!!!
cool idea
I am fascinated by hedging techniques and I have been studying different concepts over the last few days.
I will update you with my results when trading starts.
Hi yesnj00,
I am glad to see that somebody is trading this Strategy.
I have been trading it like that as well.
Sometimes the results are very nice.
But like you said , i also need to find the best moment to enter the trades.
Are you still trading this method?
Best regards,
Jacinto.
chamane,
yes there is, check out this link for correlation tables:
I tried that strategy above by waiting for gaps and buying the bottom pair and selling the upper pair and i really liked its concept but it need some adjustments as far as what pairs to trades and what is the critiria. so far this is what i observed:
1-the order of pairs changes with differnt time frames so on the 1 min one pair could be the top and on the 15 min, same pair could be at the bottom, so its confusing who is up or down, but i used the 1 min so far.
1- using the 1 min, watch for spreads at the time of entry, i noticed FXCM spreads increases spoiling my entry.
2- the pairs dont move the same number of pips, so sometime i find myself at even or a lose even after the pair touches. if you are on the wrong side of the stronger pair, you will lose.
3- sometimes the gap just keep getting wider and wider and if you have the wrong pairs you could lose lots of pips.
4- once you are in a trade, you dont how how long it will take before the pair closes again, this could take mins or long hours, and you have to be infront of the pc to close manualy.
but again, i liked it so much because it is systematic and dont require forcasting trends, but it still need some work!!!You guys do realize that when they converge is completely arbitrary on the software program. They can easily move the converging point up or down as new data comes in, it is kind of like repainting.
it looks simple to me === what people try to preach here
eur/chf at a constant
usd/chf , of course, USD on top ;; euro/usd , usd on bottom
i.e. this way, you are DOUBLING your exposure
metatrader
Is there a way to overlay charts on metatrader ???
thanks!
Dreamliner,
Interesting strategy. Do you know of any place where we can get a correlation table for every timeframe? I know how to calculate it, but it would be handy to have it available.
I would also like to know how long you have been trading that strategy and what are your results so far? What I find difficult is to find the best moment to enter a trade. I sent a picture of what I think could be used for that. For the EURUSD and USDCHF pair couple (also EURAUD/AUDCHF and EURGBP/GBPCHF), we could wait for a divergence and then for an oscillator like CCI to reach overbought/oversold zones (see red vertivcal lines on the pic). From there, you know there is a probability that price of the two pairs will converge together. Then use an indicator like Heiken Ashi to confirm the convergence and exit when either one of the Heiken Ashi changes color or at the cross of the two pairs.
In my example, I entered my trades from the Heiken Ashi signals only, but it would be better if an oscillator can be used as an alert prior to entries.
My 2 cents.
Regards.
Chamane

Hi Chamane,
I see you have managed to overlay 2 pairs on one MT4 chart,can you explain how you did this please?
- Free trading apps
- Over 8,000 signals for copying
- Economic news for exploring financial markets
You agree to website policy and terms of use
Greetings,
Several on here are posting hedging strategies, so I thought I would post one I have been trading for about a week. It has all been positive because I do not use stop losses. I am posting this here because people are usually able to pick holes in the strategy and show where it would fail, and I want to know this before I keep trading it. Here it is:
1. Go do dailyfx.com and click on "charts" and "live charts" and open up a EUR/USD.
2. Click on "instruments" and overlay a GBP/USD chart.
3. Choose any timeframe (I use 30 minutes).
4. Notice how the currencies flip flop, up and down on each other. At one time GBP/USD will be on top, then a couple hours later or a day later EUR/USD will be on top.
5. Buy the currency that is on the bottom and simultaneously sell the currency that is on the top.
6. When they converge and cross exit for the win.
So we are entering the position when there is a gap between these currency pairs, and we are exiting when the currency pairs cross (the one that was on the bottom is now on top, the one that was on the top is now on the bottom).
Obviously the bigger the gap between the two currencies upon entry the better.
I trade with 1000 units per $100.00 account balance or 10,000 units (mini lot) per $1,000.00 account balance.
This system has produced a return of approximately 15% on my account balance in the previous week.
This can also be done with GBP/JPY and EUR/JPY.
Please comment on this strategy as able.
Basic questions on how to open charts, overlay charts, etc. will not be answered as I do not have time to discuss anything but the strategy itself.