Market condition and EAs
I will start with recent market coindition..
Some people said that marker is reversing ...
The other people said that market reversed ...
Or that it is reversing but not finally ...
What is reversal?
I will not do any technical analysys here but I will give some vision of the situation how I understand it.
I understand Ichimoku indicator so I will post some charts with explanation.
---------
All indicators, EAs and templates - see
Look at this post which I did in elite indicators section. It was in 07-29-2008.
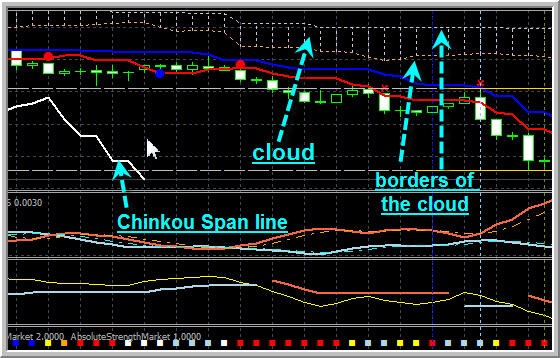
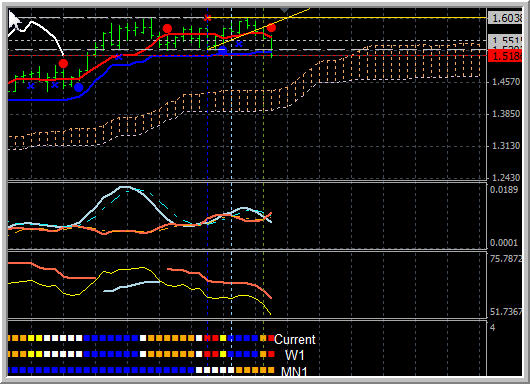
As we see, Chinkou Span line (white line) finally crossed the price on D1 timeframe for EURUSD. It was somewhere between 31st of Jule and 04th of August:

When Chinkou Span line (white line) crossed the price on D1 timeframe on close bar so it is the most strongest signal (to reverse or to trend changing).
If we understand that:
- price is below the cloud is downtrend (borders of the cloud is support/resistance lines);
- price is in above the cloud is uptrend;
so crossing this white line together with the price coming out of the cloud (crossing the coud as well) - it is reversal.
What is cloud?
Look at this image:
This template with indicators you will find in this elite section thread.
Do you want to estimate it more quickly without any template downloading?
No problem.
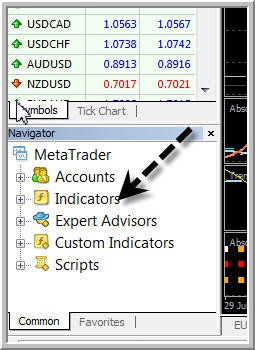
1. Open Metatrader;
2. Open EURUSD D1 chart;
3. Attach Ichimoku indicator to the chart with default settings;
4. Change the color of Chinkou Span line to be like on the images:
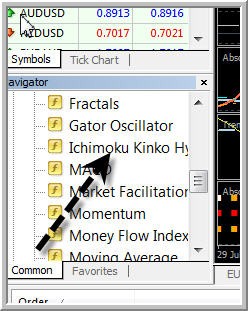
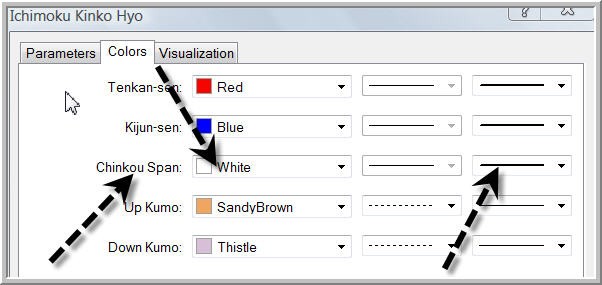
So, basicly you do not need any special indicators or templates for that. Ichimoku is standard indicator in Metatrader.
So, as we see: the white line (Chinkou Span) crossed the price for EURUSD on D1. It was somewhere between between 31st of Jule and 04th of August. And after that price crossed the cloud.
Downtrend for EURUSD on D1 timeframe.
It is not often case with reversal on D1.
It is the first such reversal case since January 2007!
It is very rare situation when Chinkou Stan line crossed the price and price crossed the cloud.
We did not have this case since January 2007.
I am not doing any technical analysis. I am just describing market condition according to my understanding.
So, before was uptrend
market reversed
and
we are having downtrend.
On D1 timeframe for EURUSD.
Why is it important for price to cross the cloud?
Because if the price is inside the cloud so it is ranging or choppy market condition (not uptrend and not downtrend).
Why some people said that reversal did not finish finally?
Why they said that everything may be changed and EURUSD may go long once again?
According to my inderstanding:
- cloud is very thin (about 17 points and it was not udifficult for the price to cross this thin cloud with this feeble support/resistance borders). We can see it from our EURUSD D1 chart.
- Chinkou Span line (white line) did not cross the price for downtrend on W1. We are still having uptrend on W1 for EURUSD. The situation may be changed next month (on W1), may be not as cloud did not change direction for the future for possible downtrend on W1. Will see.
It is W1 timeframe:
That is why some people said that the situation may be changed and it is just a correction of EURUSD on the way to uptrend.
So, as we see, this reversal (D1 timeframe, Ichimoku indicator) is the first one since January 2007.
I mean - so strong is the first one.
------------
Just some joking comment ...
How azmel could sell his PID EA during the market reversal? 
Because this market reversal is very very bad for any MTF EAs and for any martingake EA ...
He started to sell his MTF martingale EA and reversal is started. Almost simultaniously as first case since 01.2007.
---------
Anyway, we are having our elite section MTF EAs (Electra; Alpha; BrainExpert_v2; TrendStrengthExpert_v2; TrendEnvelopeExpert_v2.2) and martingake EAs (10p3v0.03 EA; Frank_mod EA; Predator EA).
We are having EAs based on breakout, we are having counter-trend EAs and trend EAs.
We know that this reversal is bad for many systems. Especially for MTF and martingale.
How those EAs are protected?
How they are performing during this condition?
What we need to improve or to do to protect our accounts/deposits?
Is it possible to improve by coding?
Or may be it was already improved and some of them are performing fine? some of them yes.
I will try to give some view about it.
Martingale EAs. Part #1.
I am testing 10p3v0.03 EA; Frank_mod EA and Predator EA.
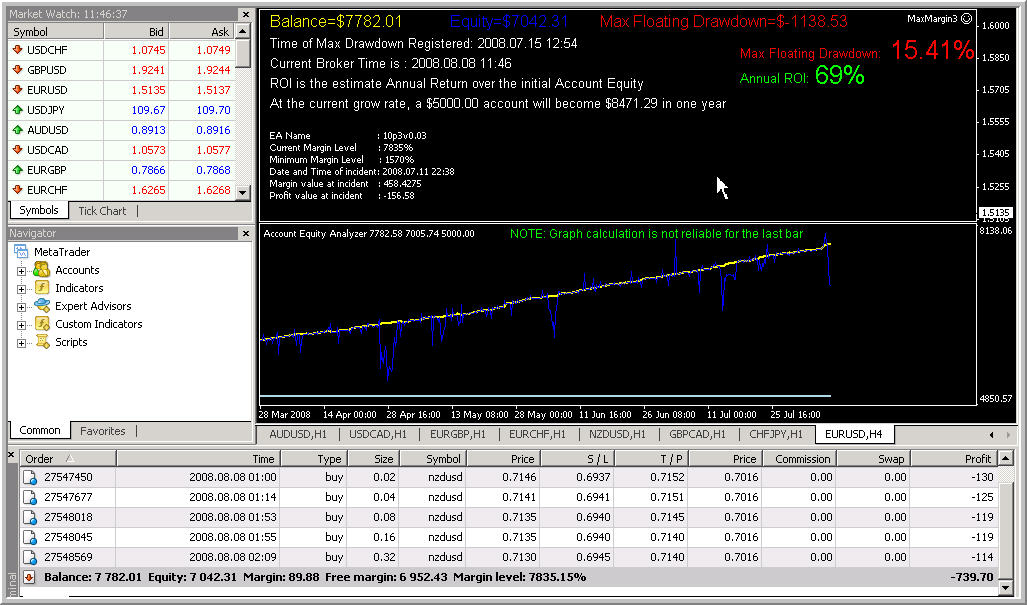
10p3v0.03 EA.
It is the latest visual statement:
Martingale EAs. Part #1.
10p3v0.03 EA.
This EA is trading at GMT night with my settings and I hope that nothing will be happened seriously. Most biggest DD was 1,138 dollars. It is 834 on open trades now.
USDNZD opened 6 orders (maximum is 10 with lot size increasing).
Anyway, we will see.
So, protection for this EA is the following (as we have it):
- i am using timefilter (EA is trading between 6 pm till 8 am at night);
- it is martingale with lot size increasing and we need just 10 pips correction at night for all the orders to be closed generally in profit for all).
- EA is not trading often.
Martingale EAs. Part #3.
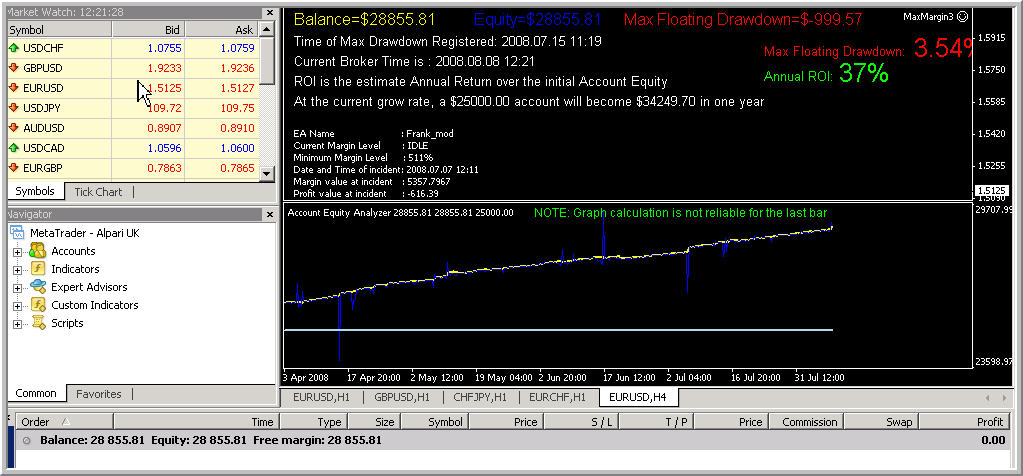
Frank_mod EA.
It is visual statement for this EA now:
- Free trading apps
- Over 8,000 signals for copying
- Economic news for exploring financial markets
You agree to website policy and terms of use
Started this thread for general review about every EA I am testing (trending, breakout, MTF and so on) concerning recent market condition. And about possible improvements and so on. I already have few ideas and many be the members will join as well so we can keep this thread as 'the thread for all EAs'.
I will try to make review about every EA and possible improvements. Will start today and will continue on Sunday or Monday.