Learn to Trend
Other condition
Other condition
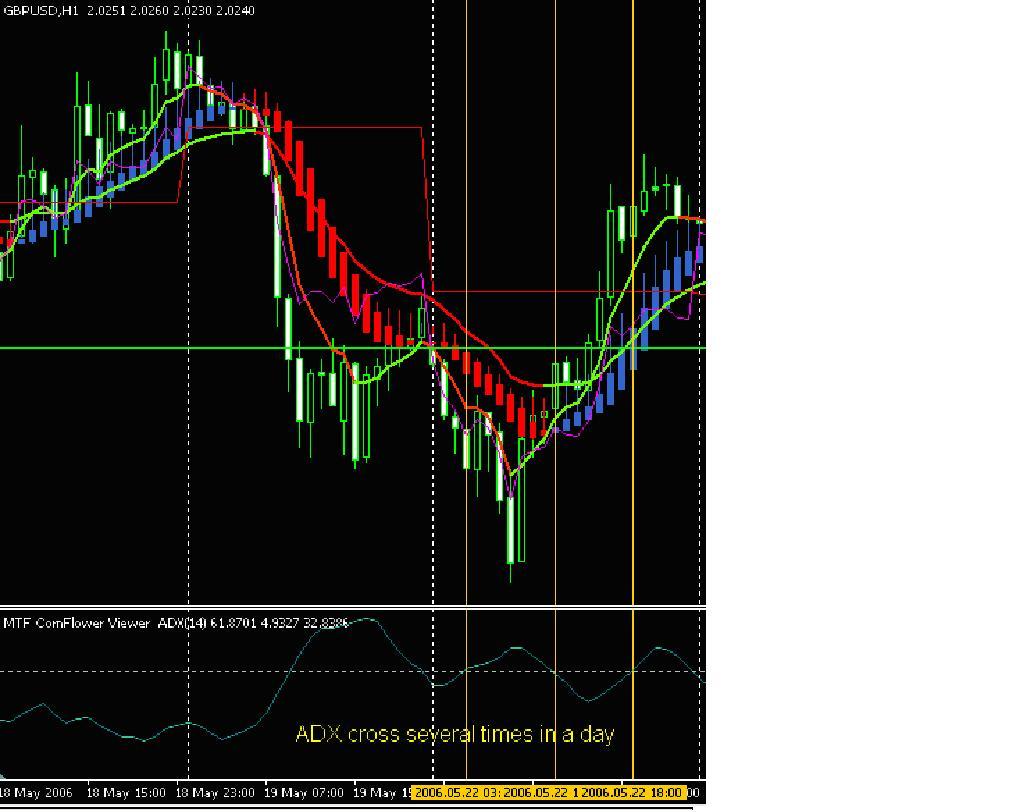
Sometimes during ranging market the ADX might cross the 35 level 2 times in a day, so much so that you see two hills top. Under this condition, rules for the method have to be slightly altered. For example the chart below, we see that the price made a reversal in the middle of the day.
Under this condition, we should get the highest price starting from GMT 0 to the time where the reversal start to occur. However, as shown in the chart the floating pivots is not fast enough to cross the daily pivots. The situation shows that this method might be a bit lagging in times when reversal suddenly occurs. I purposely pointed this out to show the shortcoming of this method.

adx
the adx is a little bit slow and often show the signsl to late.. you maybe try Jurik Adx /JCF Baux......
I like the idea of measuring if the trend is still in direction after resting. But through the daily pivot its only working in this timetrame and also little bit slow..
regards
and thx for good idea
Thanks for the support
the adx is a little bit slow and often show the signsl to late.. you maybe try Jurik Adx /JCF Baux......
I like the idea of measuring if the trend is still in direction after resting. But through the daily pivot its only working in this timetrame and also little bit slow..
regards
and thx for good ideahi
Thanks for the comment, I will look into it and make improvement.
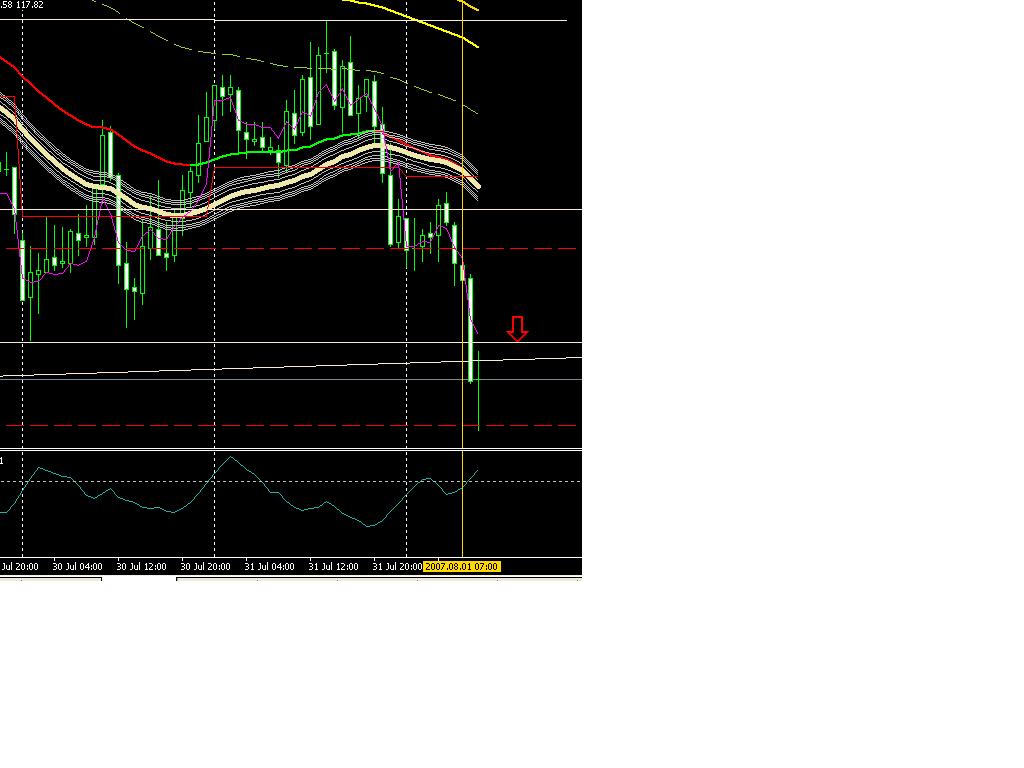
Example
Today there is a good trade for dollar yen, pls see chart. The pviot point is very close and price breakthrough the previous day low and the ADX cross 35.
I hope this example can help you to understand the method I used better.
Enjoy Trading!!!
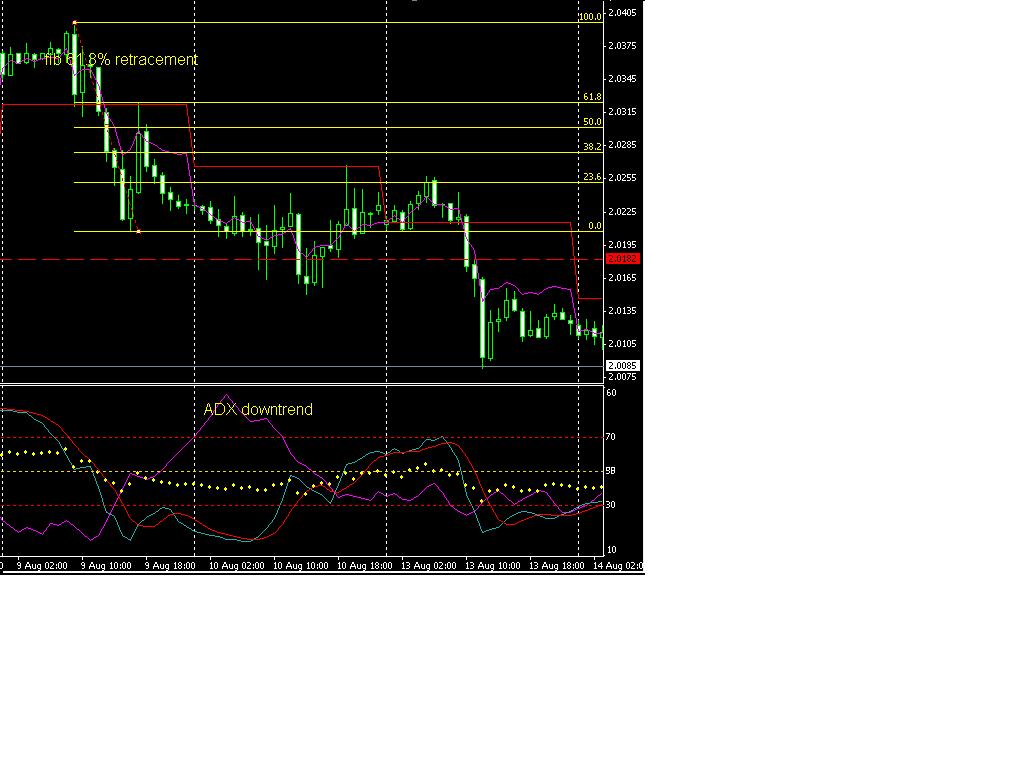
Update
on the 9Aug 2007 the GBP has a fib 61.8% retracement and thereafter the trend of GBP is quite choppy on Friday (10 Aug).
Notice that the ADX is in the downtrend towards the 35 level on Friday. So I will aviod this market next time.
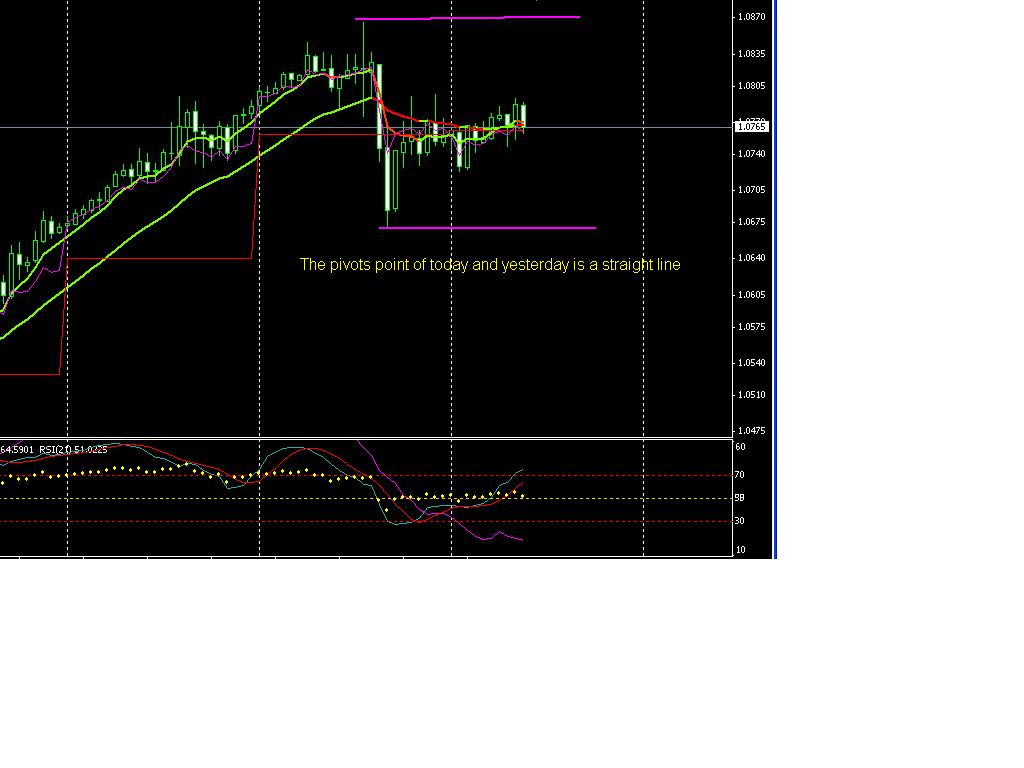
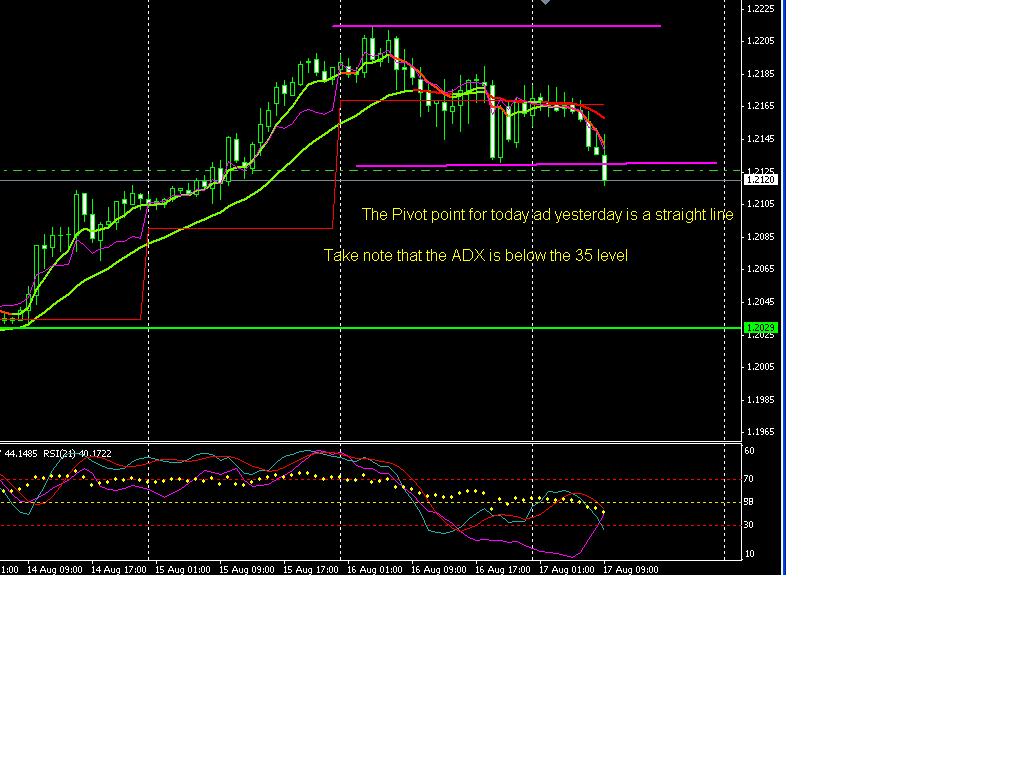
Straight Line pivot point
Hi,
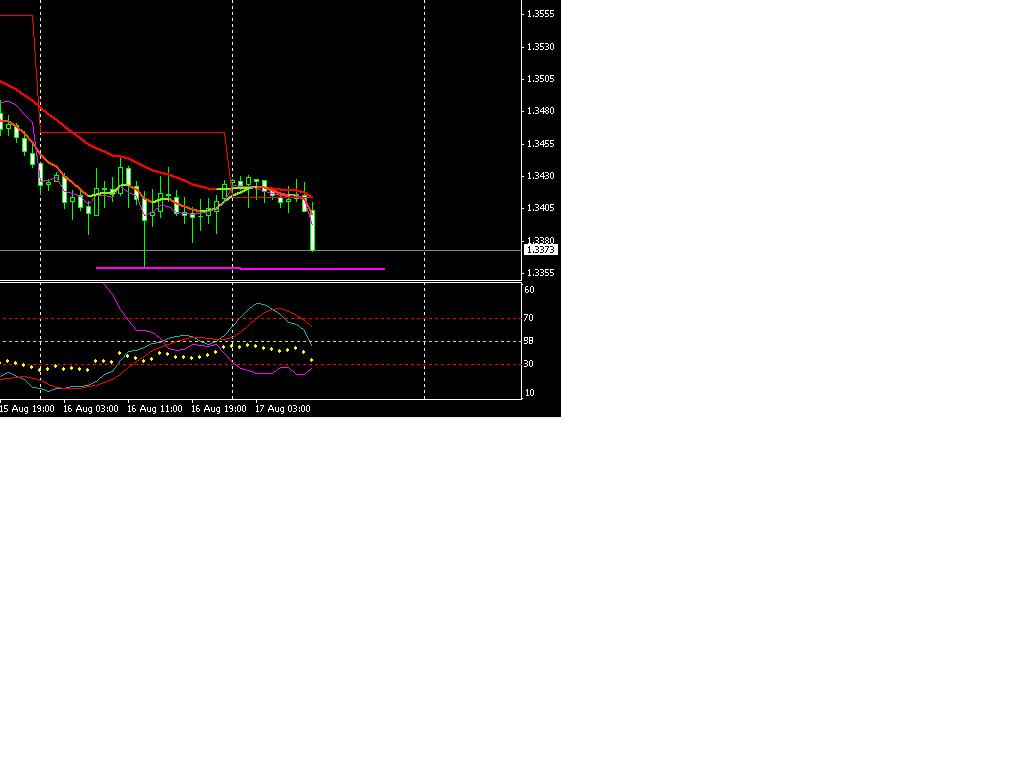
Today I spotted two currency pairs with PP line straight (Please refer to the chart below).
The ADX is also well below the 35 level. So now I shall wait and see if the price breaks the previous day hi / lo and whether the ADx actually moving towards the 35 levels (north).
Let's wait and see if they trend.
Regards
EUR Dollar
Hi,
As for the EUR, I saw a hammer yesterday and this seem to be a very strong support on the daily chart.
For the hourly chart I have drawn a previous day line to see if the price manage to break through together with the ADX signal.
Personally, I do not dare to touch the EUR today except scapling maybe.
Regards
Cheong
EUR and CAD
Hi,
It looks like the EUR and CAD is not going to performance on the london session. 
Lets wait for the US sessions then.
Regards
- Free trading apps
- Over 8,000 signals for copying
- Economic news for exploring financial markets
You agree to website policy and terms of use
Background
I am a newbie who came to know about this forum for less than a year. I am glad that many members here are kind to share their knowledge and experiences on forex trading. Indeed, I had learn a lot of many things in this forum.
Objectives:
The purposes of starting this thread is that I think forex trading are very dynamics and can be complex at times. Traders need to learn and update themselves to be able to excel in the market. Therefore, it is important to share knowledge and learn from others at the same time. In this thread, I will share and update my understanding on how to catch trend, and would happy to if someone could join in if they have better ideas.
Please also note that I do not intend to make it a system that teaches or tell people when to place their position at this moment rather I believe using this method can give you an extra references before a decision is made.
Setup:
TF: 1H
ADX: Set to period 14, level 35
PrevDayandFloatingPivots: No setting needed
Stocastic (14,5,5)
RSI (21)
Time for trading GMT 0800 to 1900
Principle:
ADX is good at indicating trend. When the indicator is moving uptrend above 35, it shows that the trend is forming. When the indicator is moving downtrend below 35, it shows that the trend is coming to a rest. So if you see the ADX crosses the 35 level, you will know that the market is telling some tales.
If you see that the Heiken_Ashi indicators is blue in colour with ADX crosses the level 35, then we can say that it is a uptrend.
If you see that the Heiken_Ashi indicators is red in colour with ADX crosses the level 35, then we can say that it is a uptrend.
Rules on uptrend
1) When ADX starts to move above level 35 and then move down to level 35, take note on the day high and low of that day. If the heiken ashi is blue in colour then this is a uptrend.
2) On the following day, if the price (full 1 hour bar) passes thought the high or low of the previous day, then take note.
3) If the Floating Pivots is above the pivot point, then quite likely the market might be a continues uptrend.
4) Otherwise, if the price move downtrend with one full hour bar passes through the previous day low, and the PrevDayandFloatingPivots indicators is on the down side, then quite likely that the market is going for a reversal.
5) If however the price on the following day did not pass through either direction (high and low of the previous day) then be alert because the price starts to move to a narrower range.
6) Under this situation, take note on the day and low again.
7) If the next following day there is a breakout above or below the previous day high and low then the trend could have starts to develop again.
Rules on downtrend
1) When ADX starts to move above level 35 and then move down to level 35, take note on the day high and low of that day. If the heiken ashi is red in colour then this is a downtrend.
2) On the following day, if the price (full 1 hour bar) passes thought the high or low of the previous day, then take note.
3) If the Floating Pivots is below the pivot point, then quite likely the market might be a continues downtrend.
4) Otherwise, if the price move uptrend with one full hour bar passes through the previous day low, and the PrevDayandFloatingPivots indicators is on the up side, then quite likely that the market is going for a reversal.
5) The rest is similar to the uptrend situation.
Optimization
a) Suggest that other indicators should be used to judge the current market trend for instances, stochastic, CCI and RSI can be very useful.
b) This method does not take into account when news is releasing.
Example
Will try to post more examples to understand the method better if I have time.
Enjoy trading!!!
New indicators update, please see post 21