The "XO"-Method......... - page 32
You are missing trading opportunities:
- Free trading apps
- Over 8,000 signals for copying
- Economic news for exploring financial markets
Registration
Log in
You agree to website policy and terms of use
If you do not have an account, please register
The XO indicator defines mini dynamic breakout bands.
We begin with the Close value of an initial bar. If the next bar closes above, it defines a band of 7 (kirper) pips just above the new close + two additional bands, one above and one below. If the next Close is above the top of the bands, the bands are again moved, the same if the new Close is below the bottom of the bands. So we have a kind of moving band that is triggered as soon as the next Close goes outside. Hope I am clear
NicoThanks Nico, you are a bright star! Much appreciated. Best wishes, always.
Here it is.
Settings @ 1st KirPER @ 7
KirPER1 = 7
2 @ 7
3 @ 6 (NB as of this morning)
4 @ 5.
Best wishes.Thank you! I was looking for the one ending with "2" on the end of the name. Did not know it was the same one.
Hi All,
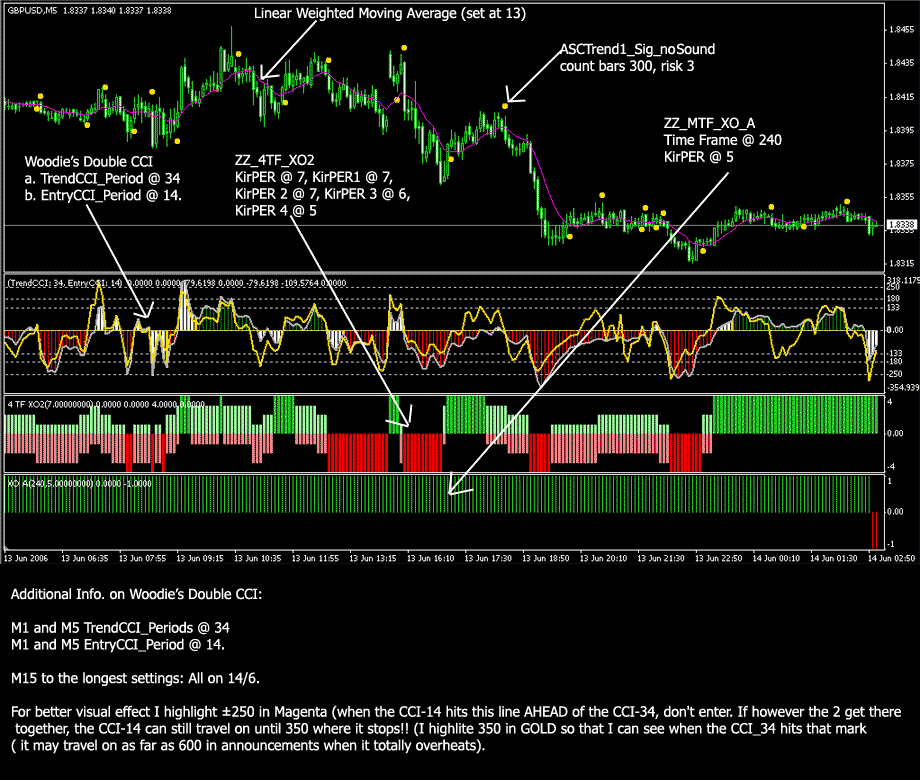
I've posted this graphic together with the latest indicators and a template. All settings as per Valeo 6/13/2006.
Valeo: Please review and let me know if all is OK.
moneyline
I apologize, it might be in here somewhere, but can someone refer me to concise documentation on the use of the Woodies Double CCI and especially the definition of overheating. Is there a post discusses this specifically?
Oh, one more thing. I noticed settings for the Double CCI for all 4 timeframes. How do we take our cues from 4 different timeframes? It's easy on the XO but I don't understand the 4 timeframes on the CCI.
Thanks.
Hi All,
I've posted this graphic together with the latest indicators and a template. All settings as per Valeo 6/13/2006.
Valeo: Please review and let me know if all is OK.
moneylineExcellent work as always, MoneyLine. Thank you for posting.
Best wishes.
I apologize, it might be in here somewhere, but can someone refer me to concise documentation on the use of the Woodies Double CCI and especially the definition of overheating. Is there a post discusses this specifically?
Oh, one more thing. I noticed settings for the Double CCI for all 4 timeframes. How do we take our cues from 4 different timeframes? It's easy on the XO but I don't understand the 4 timeframes on the CCI.
Thanks.By kind co-operation from MoneyLine who posted it on Page 12 #115.
I don't understand the 4 TFs either, but that it works is a sure fact.
I apologize, it might be in here somewhere, but can someone refer me to concise documentation on the use of the Woodies Double CCI and especially the definition of overheating. Is there a post discusses this specifically?
Oh, one more thing. I noticed settings for the Double CCI for all 4 timeframes. How do we take our cues from 4 different timeframes? It's easy on the XO but I don't understand the 4 timeframes on the CCI.
Thanks.Hey folks. The Double CCI was made so you can set it to "Auto Timeframe setting" with different settings and move back and forth between timeframes and not have to keep changing your settings. Not as a multi-timeframe indicator.
So, when it's set to "off" then whatever's chosen at the top as your Trend/Entry default will be your settings in all timeframes.
Edit: Oh, btw, here are a few multi CCI's with the original default set at 50 and 2 more set at 25 and 34.
XO and Asctrend
The ASCTREND dots seems not to always coincide with the XO indicators, that is, when all are green or all are red, I still get ASCTREND dots. Does the ASCTREND dots have any significance?
On my screen, the Asctrend dot appears when the XO are a mixture of green and red for either a long or short. Its very rare that the dot appears when the XOs are either all green or all red. Am I missing something? I know ASCTREND is probably looking at something else to generate its signals....
Hi,
To get an idea of how often a good signal is generated why don't you scroll through and check it out?
Let me know,
moneyline