It's not an easy job, but initially the approach seems to be wrong - through trend lines-objects.
Why not through Bitmap-object with custom resource - canvas? Most likely, the mat. lib will be implemented in 3D in this way.
It's not an easy job, but initially the approach seems to be wrong - through trend lines-objects.
Why not through Bitmap-object with custom resource - canvas? Most likely, the mat. lib will be implemented in 3D in this way.
And then how to realise interactivity (control of the 3D object)? How to react to the change of timeframe, chart scale, window change, new tick (bar) and many others?
In this implementation, the terminal and MQL5 language functionality do it all, and there is no need to program anything. I.e. a simple solution to a complex problem is offered.
And then how to realise interactivity (3D object control)? How to react to a change of timeframe, chart scale, window change, new tick (bar) and many others?
In this implementation, the terminal and MQL5 language functionality do it all, and there is no need to program anything. I.e. a simple solution to a complex problem is offered.
Just through the kanvas. I posted a tick indicator on this principle in Kodobaza. The interactivity is quite strong there.
A bit of interactivity and mat. bibla now knows how to do it
Forum on trading, automated trading systems and testing trading strategies.
fxsaber, 2016.11.14 10:11 AM
Please finalise CGraphic and CCurve. They are weak classes. And it is almost unrealistic to inherit from them, because the necessary is private. It took me a long time to get into it, but to correct them to normal operation, I had to rewrite the classes myself.
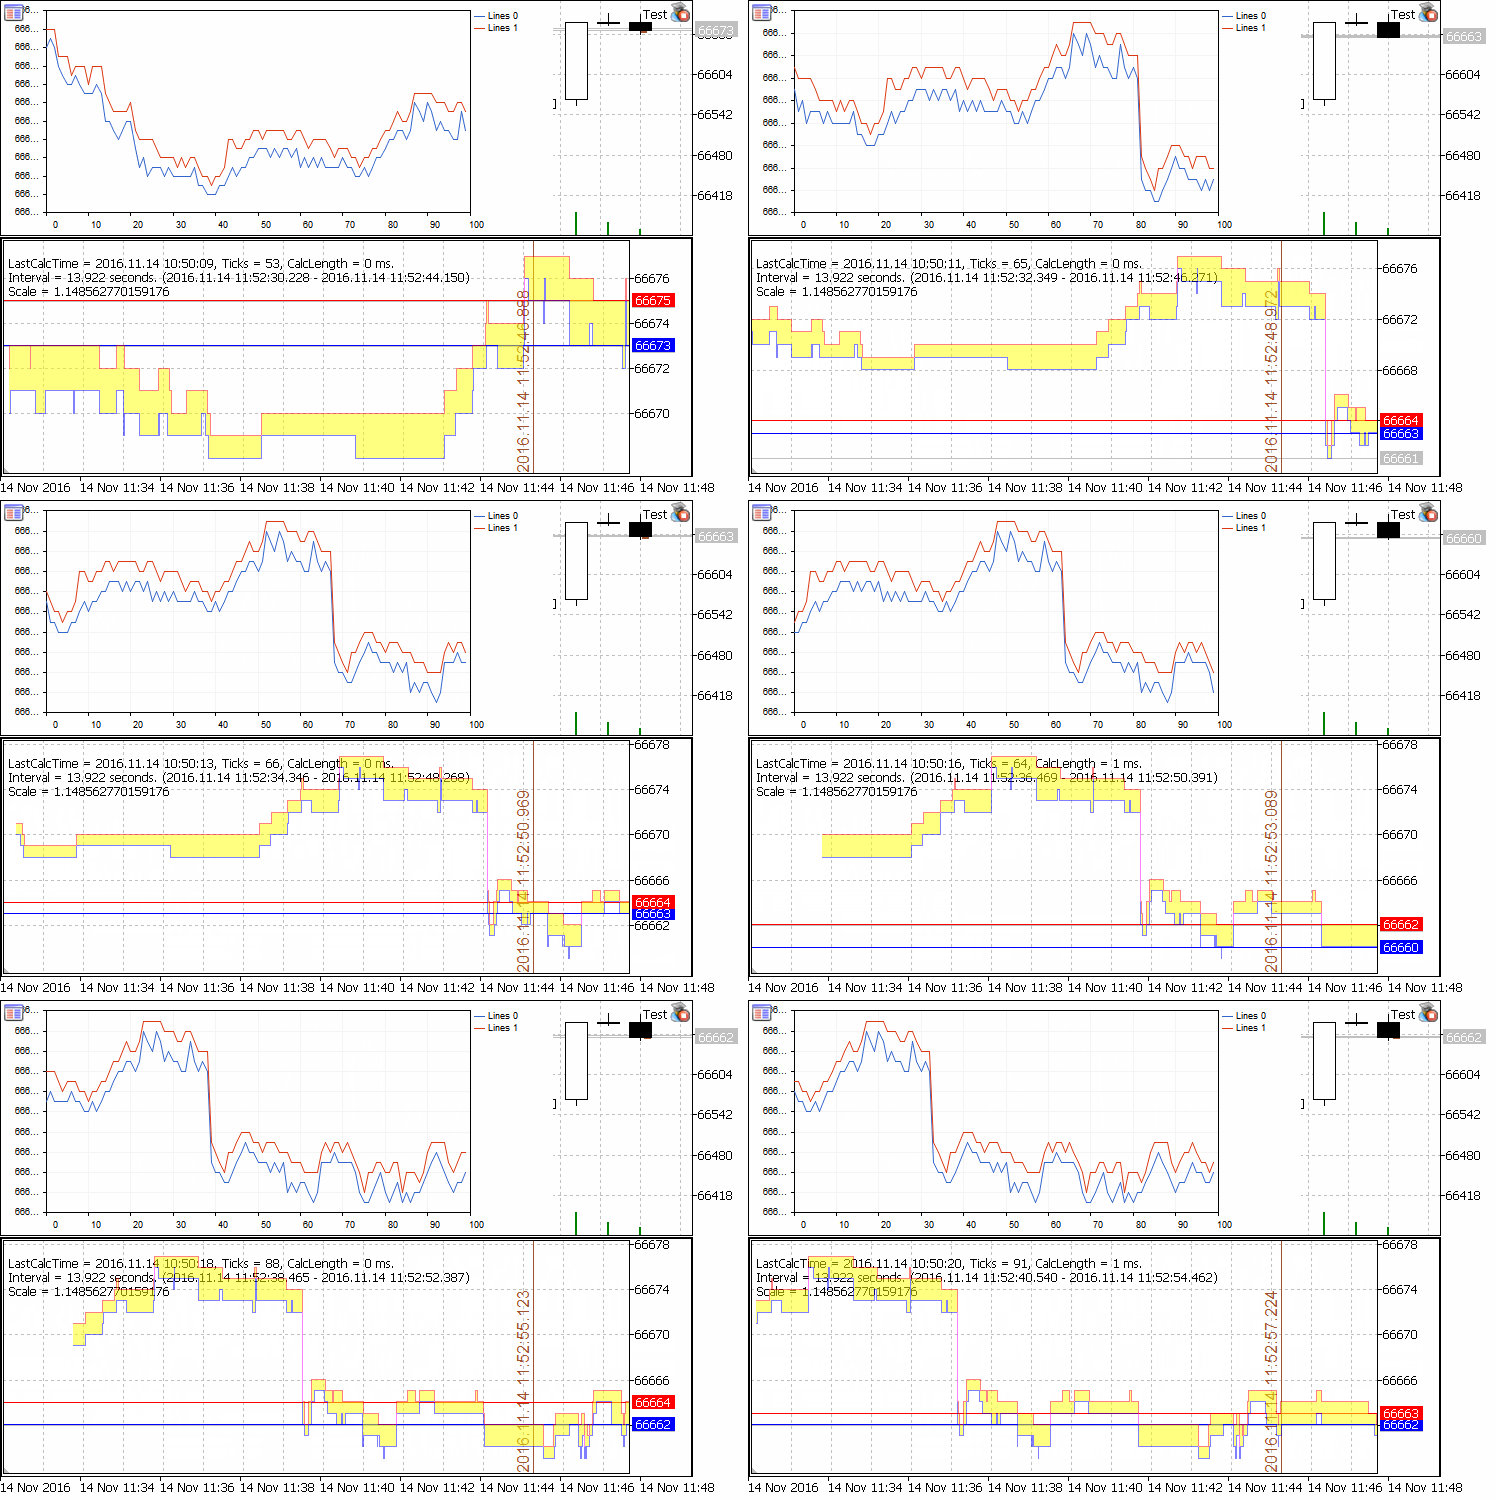
I wanted to make an interactive tick chart - it came out only crudely (without rewriting classes)
void GetPrices( double &Bids[], double &Asks[], const int Count = 100 )
{
MqlTick Ticks[];
const int Amount = CopyTicks(_Symbol, Ticks, COPY_TICKS_INFO, 0, Count);
ArrayResize(Bids, Amount);
ArrayResize(Asks, Amount);
for (int i = 0; i < Amount; i++)
{
Bids[i] = Ticks[i].bid;
Asks[i] = Ticks[i].ask;
}
}
CGraphic* Graphic = new CGraphic;
const string Name = "Graphic" +(string)(GetTickCount() + MathRand());
void OnDeinit( const int Reason )
{
Graphic.Destroy();
delete Graphic;
ChartRedraw();
}
void GraphTicks( const double &Price1[], const double &Price2[] )
{
Graphic.Destroy();
delete Graphic;
Graphic = new CGraphic;
Graphic.Create(0, Name, 0, 0, 0, (int)(ChartGetInteger(0, CHART_WIDTH_IN_PIXELS) * 0.8), (int)ChartGetInteger(0, CHART_HEIGHT_IN_PIXELS));
Graphic.AddCurve(Price1, CURVE_LINES);
Graphic.AddCurve(Price2, CURVE_LINES);
Graphic.PlotAllCurves();
Graphic.Update();
}
void OnTick()
{
double Bids[], Asks[];
GetPrices(Bids, Asks);
GraphTicks(Bids, Asks);
}

No DeleteCurve, ChangeCurve, etc.
And then how to realise interactivity (3D object control)? How to react to a change of timeframe, chart scale, window change, new tick (bar) and many others?
In this implementation, the terminal and MQL5 language functionality do it all, and there is no need to program anything. I.e. a simple solution to a complex problem is offered.
Is the topic of the article some kind of interactive control? The topic of the article is 3D modelling. Where is the magic function in it where you give spatial coordinates and get screen coordinates as output?
Not only is the topic not disclosed in the article, but it even seems that the author has no idea what the essence of this topic is.
It's not an easy job, but initially the approach seems to be wrong - through trend lines-objects.
Why not through Bitmap-object with custom resource - canvas? Most likely, the mat. lib will be implemented in 3D in this way.
It should not be both, they are mapping options. Initially everything should be in arrays.
So the 3D array is the raw data. I think we're talking about visualisation.
If only... no visualisation at all.
Is the topic of the article some kind of interactive control? The topic of the article is 3D modelling. Where in it is the magic function where you give spatial coordinates and get screen coordinates as output?
In the article not only the topic is not disclosed, but it even seems that the author does not realise the essence of this topic at all.
3D - without the ability to change the point of view - is 2D drawing. Therefore, interactivity is the most important quality in modelling three-dimensional objects. What is the point of a static picture?
There is a magic function and an example of its use is given.
- Free trading apps
- Over 8,000 signals for copying
- Economic news for exploring financial markets
You agree to website policy and terms of use
New article 3D Modeling in MQL5 has been published:
On financial markets, 3D modeling can be used for example to provide a three-dimensional representation of time series. A time series is a dynamic system, in which values of a random variable are received continuously or at successive equally spaced points in time (ticks, bars, fractals, etc.) In this article, we will consider the three-dimensional visualization of time series and indicators (See Fig. 1).
Fig. 1. Examples of three-dimensional representation of time series.
Author: Sergey Pavlov