Forecast and levels for Dax Index
Forum on trading, automated trading systems and testing trading strategies
Sergey Golubev, 2017.01.10 15:07
Dax Index Daily: bullish flat within narrow s/r levels waiting for direction (based on the article)
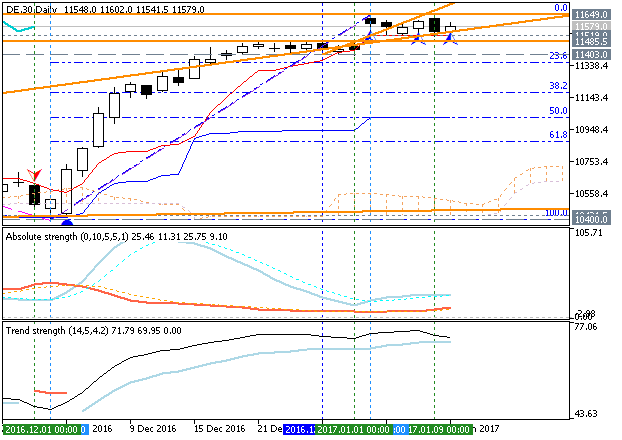
- "The current chop is taking on the shape of a bull-flag and looks poised to break soon, but may need a day or two more of filling out first. The first level of contention on a push higher comes in quickly at the 1/3 swing high at 11637, and upon breakout the DAX will begin looking to test a series of swing highs created during the descent from the record high in 2015. Top-side levels in focus: Aug ’15 – 11670, Jul ’15 – 11802, and May ’15 – 11920."
- "Should the recent backing-and-filling turn into something more aggressive, we will look to the top of the late-December channel at 11481 and bottom of the channel around 11400 as key points of support. It would be important to hold onto the low end of that channel and the low of the day (1/2) which began the year. A drop below 11400 would be damaging for prospects of higher prices, and warrant a shift in bias towards lower prices. But for now, the DAX is acting well, global risk appetite remains relatively healthy, so we will roll with the notion of seeing higher prices in the not-too-distant future."
Forum on trading, automated trading systems and testing trading strategies
Sergey Golubev, 2017.01.12 14:13
Dax Index Daily: possible breakout (based on the article)
Daily price is located above Ichimoku cloud in the bullish area of the chart within the narrow support/resistance levels:
- 11,691 resistance for the bullish trend to be resumed, and
- 11,485 support level for the secondary correction to be started.
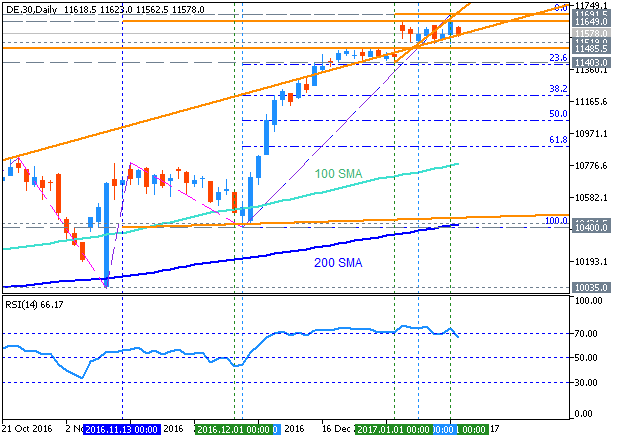
- "Today, we are seeing the DAX drop back into the middle of the consolidation pattern, which presents the risk that we are seeing a valid rejection upon an attempt to break higher out of a bullish pattern. It’s too soon to become outwardly bearish, but this price behavior does give pause to the bulls at the moment and could become meaningful if downside levels are taken out."
- "There is a lower parallel coming into play around current market prices, keep an eye on this as the first level of support. If slope support fails, then in order to at least keep the recent consolidation phase in play the DAX should hold around the 11525 level, and if not, look for the top of the digestion period from the end of the year to act as support around 11480. A break below 11480 would quickly bring in the Jan 2 low at 11414 and bottom end of the consolidation which led to the rally to start the year. At that point the sequence of rally, consolidate, rally, would be completely broken and a sign of developing trend change, even if only for a short period of time."
Forum on trading, automated trading systems and testing trading strategies
Sergey Golubev, 2017.01.19 14:56
Intra-Day Fundamentals - NZD/USD, USD/CNH and Dax Index: Philadelphia Fed Business Outlook Survey
2017-01-19 13:30 GMT | [USD - Philly Fed Manufacturing Index]
- past data is 21.5
- forecast data is 16.3
- actual data is 23.6 according to the latest press release
if actual > forecast (or previous one) = good for currency (for USD in our case)
[USD - Philly Fed Manufacturing Index] = Level of a diffusion index based on surveyed manufacturers in Philadelphia.
==========
From official report:
"The index for current manufacturing activity in the region increased from a revised reading of 19.7 in December to 23.6 this month.* Forty percent of the firms reported increases in activity this month; 17 percent reported decreases. The general activity index has remained positive for six consecutive months, and the activity index reading was the highest since November 2014 (see Chart 1). The other broad indicators suggest sustaining growth. The index for current new orders increased 11 points this month, with 41 percent of the firms reporting increases. The shipments index remained at a high reading but fell 1 point. Both the delivery times and unfilled orders indexes were positive for the third consecutive month, suggesting longer delivery times and an increase in unfilled orders."
==========
NZD/USD M5: 32 pips range price movement by Philadelphia Fed Business Outlook Survey news events

==========
Dax Index, M5: range price movement by Philadelphia Fed Business Outlook Survey news events

==========
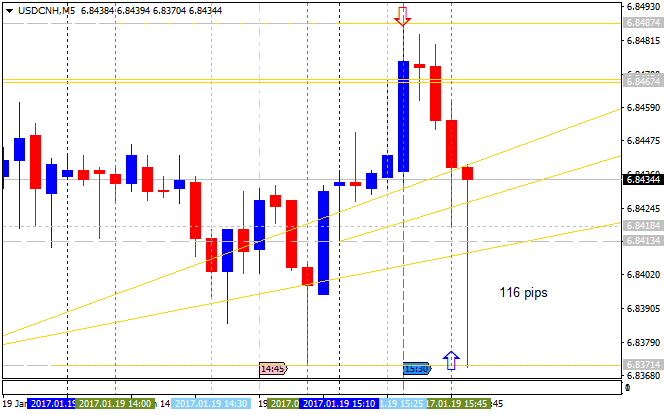
USD/CNH M5: 116 pips range price movement by Philadelphia Fed Business Outlook Survey news events
Forum on trading, automated trading systems and testing trading strategies
Sergey Golubev, 2017.02.01 14:54
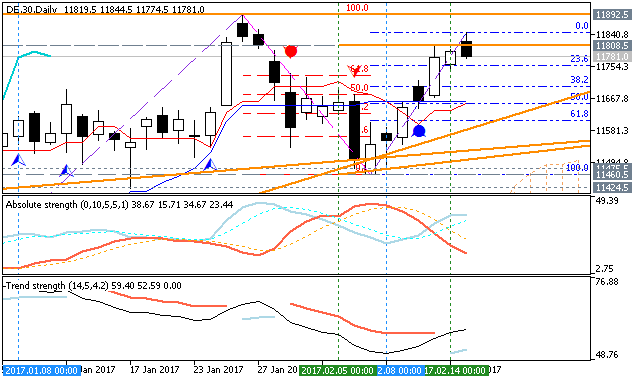
Dax Index - daily bullish ranging waiting for the bullish to be resumed or to the ranging bearish reversal (based on the article)
Dax Index daily is located above Ichimoku cloud in the bullish area of the chart within the following support/resistance levels:
- 11,892 resistance located far above Senkou Span line in the bullish trend to be resumed, and
- 11,403 support level located near and above Senkou Span line which is the virtual border between the primary bearish and the primary bullish trend on the chart.
If the price breaks 11,892 resistance on close daily bar so the bullish trend will be resumed.
If the price breaks 11,403 support level to below so the reversal to the bearish condition will be started with the secondary ranging way - the price will be located inside Ichimoku cloud.
If not so the price will be on bullish ranging within the levels.
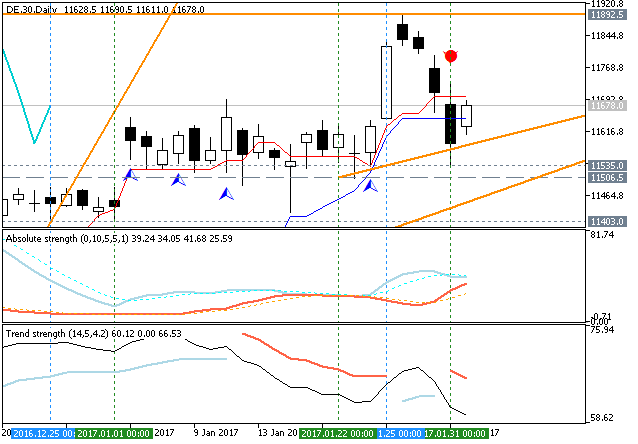
- "It’s been a sharp turnaround – easy come, easy go – with yesterday accounting for a large share of the recent losses. This puts the DAX in an interesting spot. The breakout from the high-level base failed, and if it doesn’t turn the downward momentum around quickly, more is likely to come. A break below 11500 would put 11408/25 into play, and below there the top-side trend-line running back to April, currently clocking in just above 11300."
- "The decline could turn out to be a short-lived pullback, but the market needs to turn, and do-so quickly. Today's gap higher may be a start, but too soon to tell. The decline from near 11900 was fairly violent, and suggests more downward momentum could be on its way. If 11500 can hold up, then the DAX could find itself setting up for higher prices; a scenario in which we’ll need to see constructive price action before becoming confident about."
Forum on trading, automated trading systems and testing trading strategies
Sergey Golubev, 2017.02.15 13:51
Dax Index: Daily bullish trend to be continuing with 11,892 level as new target high (based on the article)
Daily price is located above Ichimoku cloud in the bullish area of the chart: price is continuing with the bullish trend by 11.808 level to be broken for the 11,892 level as the new daily target.
- "Levels to watch on the top-side start with the Jan high at 11893, and then just above there we have to go back to a swing high created in May 2015 at 11920 and a month before that at 12079. We’ll focus first on those levels, worry about the record 2015 high at 12391 later should ‘momo’ really kick in."
Forum on trading, automated trading systems and testing trading strategies
Sergey Golubev, 2017.02.15 13:59
Dax Index: Intra-day hourly correction (based on the article)
Intra-day H1 price is above 200 SMA in the bullish area by the bouncing from 11.844 resistance level to below for the secondary correction to be started with 11.656 support level as a bearish reversal target. Alternative, if the price breaks 11.844 resistance level to above on H1 close bar so the primary bullish trend will be resumed.
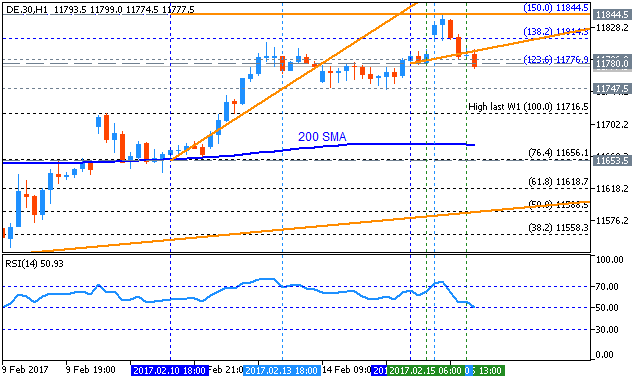
- "Looking to the hourly chart, the surge starting last week is morphing into a sharply angled channel which could help keep short-term traders guided on the right side of the tape. Even if it were to break the structure a bit by moving outside of it, as long as higher highs and higher lows continue to etch themselves out then there isn’t good reason to be a hero here trying to find a top. Again, though, for day-traders it’s a different story, but will still likely to find it easier to be on the bid rather than the offer for the time-being."
Forum on trading, automated trading systems and testing trading strategies
Sergey Golubev, 2017.02.18 18:03
Weekly Fundamental Forecast for DAX Index (based on the article)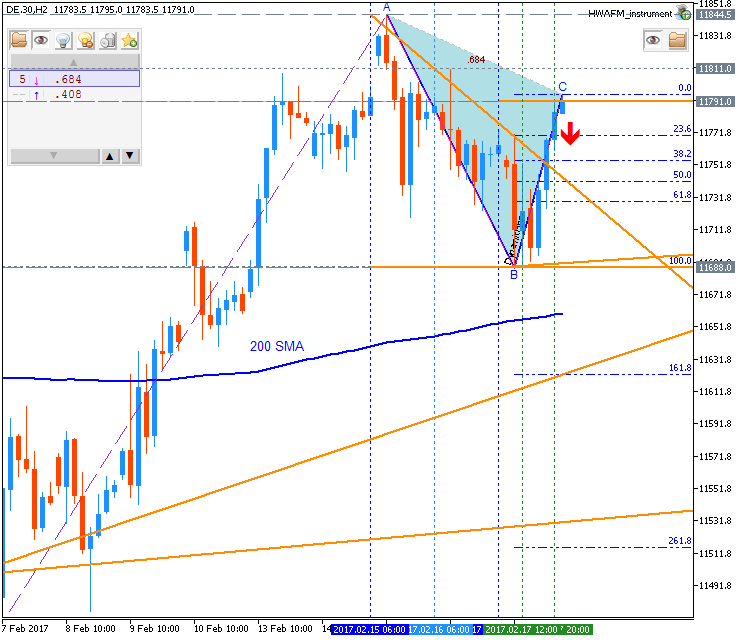
Forum on trading, automated trading systems and testing trading strategies
Sergey Golubev, 2017.02.26 13:56
Weekly Fundamental Forecast for DAX Index (based on the article)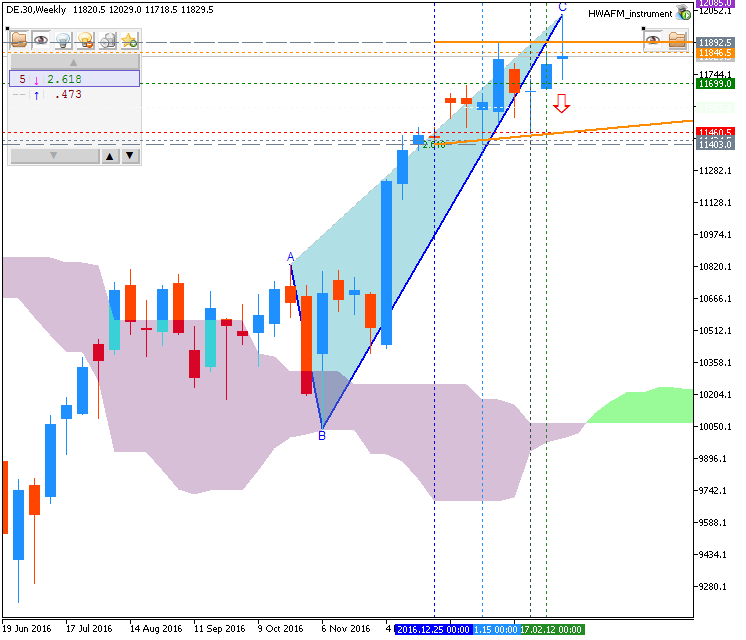
DAX Index - "Key Eurozone and German data on the docket begins with Eurozone CPI at 10:00 GMT on Tuesday; German employment data on Wednesday at 8:55, and later in the day German CPI at 13:00; Friday we will get a look at Italian GDP for Q4 at 9:00, but not likely to have much impact on German equities. Moving on to the chart: The DAX broke hard on Friday, shedding 1.2%, just a couple of days after touching off a confluence of top-side trend-lines. The break lower held at the December trend-line, managing to put in the day’s low just beneath it. The index will need to respond shortly to support or else we will have to start looking for more selling towards the next area of significant support in the 11400/500 vicinity."
Forum on trading, automated trading systems and testing trading strategies
Sergey Golubev, 2017.03.10 11:51
Dax Index - ranging with the bullish trend to be resumed (adapted from the article)
Daily price is located above Ichimoku cloud in the bullish area of the price: symmetric triangle pattern was crossed by the price to above for the bullish trend to be continuing with 12,099 resistance level.
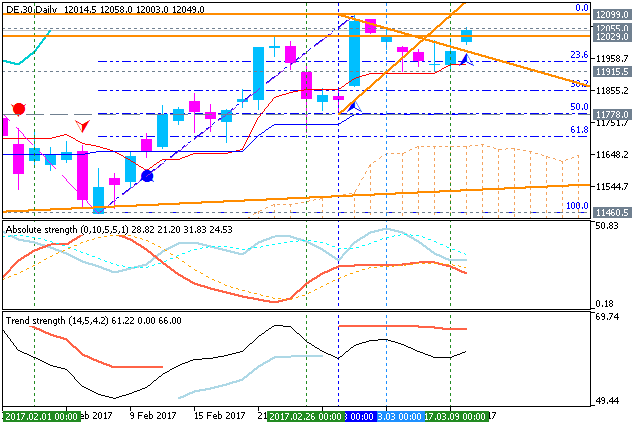
- "This week the DAX put the December trend-line to the test, teetering on the brink of breaking it over the course of the past two sessions. But so far, so good. The outcome from yesterday’s ECB meeting was relatively benign and thus had limited impact on financial markets – namely the euro and European equity indices."
- "For now, we are running with support acting as, well, support. It is until it isn’t. But the DAX will soon be facing off with resistance in the form of the Feb high of 12082 and then the top of the rising wedge/2016 trend-lines. As far as the rising wedge goes, we will go with which ever direction it breaks – a pattern to react to, not predict."
The statement for trading the following:
- AUD/JPY;
- NVIDIA share;
- Apple share;
- Gold;
- US Treasury Bond 30YR.

Forum on trading, automated trading systems and testing trading strategies
Sergey Golubev, 2017.03.11 18:57
Weekly Fundamental Forecast for Dax Index (based on the article)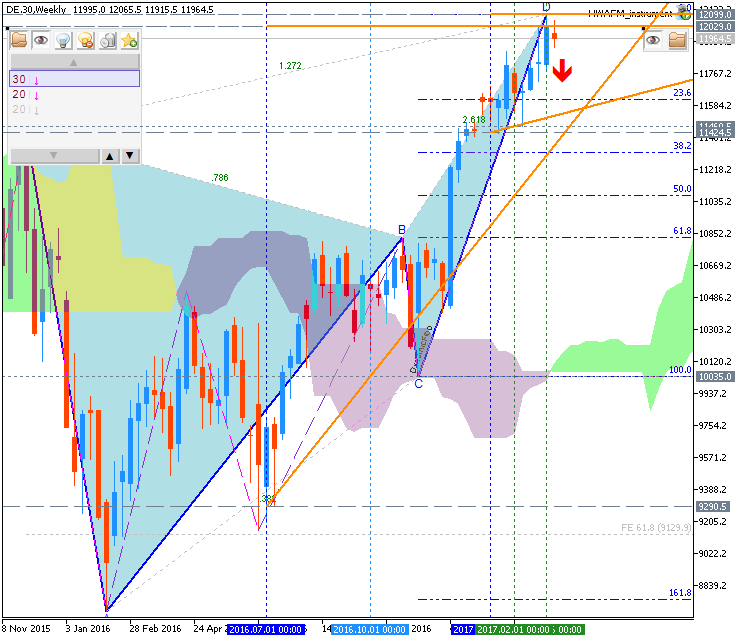
Dax Index - "There isn’t a whole lot of key data this week out of Germany or the Eurozone, with the only ‘high’ impact data slated for Tuesday when the German ZEW Survey will be released. The market will likely focus on how risk markets perform surrounding the FOMC and BoJ meetings."
- Free trading apps
- Over 8,000 signals for copying
- Economic news for exploring financial markets
You agree to website policy and terms of use
Dax Index January-March 2017 Forecast: flat within bullish with key resistance at 11,649
W1 price is located above Ichimoku cloud in the bullish area of the chart. The price broke 11,485 level to above on close weekly bar with 11,649 as a nearest bullish target to re-enter. Thus, the weekly price is located within the following key narrow support/resistance levels:
- 11,649 resistance level located above Ichimoku cloud in the bullish trend to be resumed, and
- 11,485 support level located above Ichimoku cloud in the beginning of the ranging market condition to be started.
Chinkou Span line is above the price indicating the ranging condition or flat, Trend Strength indicator is estimating the trend as the primary bullish, and Absolute Strength indicator is evaluating the trend as the flat. Tenkan-sen line is above Kijun-sen line for the bullish trend to be resumed in the near future.Trend:
W1 - ranging bullish