Ubzen System Development Process - page 2
You are missing trading opportunities:
- Free trading apps
- Over 8,000 signals for copying
- Economic news for exploring financial markets
Registration
Log in
You agree to website policy and terms of use
If you do not have an account, please register
Tho I don't have the Time-to-Mae/Mfe tool figured out yet, I've decided to post what I've got. This method I've had in my mind for some time now. Here, we're only concerned with how much MAE/MFE the trades generated within a certain period of time ex) 1-Hour. The goal is to determine if the signal is right on direction, but not-necessarily right away. Say, you're testing a Buy signal and it shows Mae=50 and Mfe=100. You can conclude that the signal is accurate. However if it was going down first before going up, it'll hit your stop-loss of 50 before getting into profit. This also sounds useful for someone who wants to take 100-pips within an hour but the system is showing 25mae-50mfe. He/She would simply fall short. EA modification for this includes stop-loss-via-time only; trade every signal and one trade per signal. Below is the work file.
Default: Total
Mfe 5354.5 - Profit 570.8= Excess Mfe 4783.7
Mae -2631.2 + Mfe 5354.5= Undermined 2723.3
Zen-Mxe 1.76
15-Minutes:
Mfe 303 - Profit 48= Excess Mfe 255
Mae -253 + Mfe 303= Undermined 50
Zen-Mxe 5.1
1-Hour:
Mfe 574 - Profit 83= Excess Mfe 491
Mae -476+ Mfe 574= Undermined 98
Zen-Mxe 5.0
4-Hours:
Mfe 1053- Profit 368= Excess Mfe 685
Mae -659+ Mfe 1053= Undermined 394
Zen-Mxe 1.73
8-Hours:
Mfe 1425- Profit 336= Excess Mfe 1089
Mae -782+ Mfe 1425= Undermined 643
Profit 336 Zen-Mxe 1.69
1-Day:
Mfe 2461- Profit 751= Excess Mfe 1710
Mae -1358+ Mfe 2461= Undermined 1103
Zen-Mxe 1.50
*Undermined is my attempt at Phillips undermine concept. (higher=better) if undermined is negative, one might consider reversing the signals.
*Excess Mfe is my attempt at Phillips EMFE concept.
*Zen-Mxe is the EMFE / Undermined. I dub thee a new Criterion. 8)) just kidding. (lower=better)
Default is the program as it was originally written. A comparison between Default and the Timed Close would not be accurate because Default is values in $$ and have variable lot sizes. Where as the rest are 0.1 sizes.
To kick this off, I started with 15-minutes expiration. I didn't intend to use such low time-frame because of multiple reasons, ex) non-tick data, interval update of the mae-mfe capture ... etc. However I included for interest of scalping. As expected, this system does not work well for scalping. The best results is the 5-hour test, not included because I didn't set out to test it. However, you can find the results of that test in the Help.zip file located in my post b4 this one.
I need to rewrite the EA in set pips so that I could attempt a fair comparison with the timed tests. However, the results from Phillip's Excess Mfe shows that it's leaving wayyyy too much money on the tables. Will be back when I have the pip comparison done.
Theres a lot of talk about MAE/MFE ..M for Maximal... but are there any attempts to single out outliers? ..for instance, a particular trade may have moved 300 pips in the adverse direction before turning a profit while most trades only move around 50.. would an mAE/mFE .. m for mean, be more descriptive?
From my limited interpretation on M?e here my take on that question. That's one reason why I sum all the Mae and all the Mfe. The 300 pips shows your willingness to hold the position 6x the average loss.... why go that low if you don't need it. Is it because you want 100% win-rate. <---- I'm not referring to Supertrade directly rather these are questions one should ask themselves.
Reason why I've bought into M?e is because I like the idea. For example coming from Blackjack (math much more static in that game), however, I have to determine a wager base on my Bankroll (Equity) vs my Edge(Sigma). If I wager 10$ (we'll leave double down's out of this for the sake of simplicity). There's only 4 possibilities 1) I Lose - She takes my 10$ 2) I win - She pays me 10$ 3) I push - Neither of us gain. or 4) Blackjack baby - She pays me bet and a half (3-to-2). 15$.
Long story short, If Bj paid 2-to-1 in reality, the Casinos would stop offering the game the same day...even tho the house will always win over 50% or rounds(trades) no matter how good you are. Here, I had to ask my self, well how much am I risking. The answer I realize is not in the size of the Lots but rather the size of the draw-down, and I'll extend that to willing draw-down. If you leave the possibility of 300-pips loss then you're actually betting 300-pips not 50. You better have a take-profit of 300 to justify that risk on a 1-1 basis.
Like Zzeug pointed out earlier. His modify version of this system was showing over 50% wins even when he's asking it for a 2-to-1 win to loss ratio. I agree, that's really as good as it gets ... but like it seems here, past results don't mean squat... because as Phillip have pointed out to me before, Trading this is Not a Static process. So, Am I saying a system with Ratios less then 1 cannot win.... No. They just usually need a higher win-rate. At some point mathematically, you either have to Win-More% of trades...similar to the house in Bj. Or you need to win the Bigger Bets like an advantage player. Unfortunately I don't know how to crank the math ;)
Yeah, I know you know most of this stuff supertrade. I just got that out so maybe some die hard scalper can differ. Simple answer to your question in my mind is M-as in maximum is your Bet.
Yeah, that makes sense if you look at it from a risk perspective.. MAE/MFE for a worst-case assessment, mAE/mFE (mean) for an overall description for how your strategy behaves.
did you say you sum all your MAE's & MFE's tho? Looking at the maximum datapoint would speak of risk but a summation would give the same information as an average.. perhaps I misread.
In regards to win rate/profit ratio.. how these variables relate is actually given by Profit Factor ..the one tester gives in the report:
PF = (Avg Win * Win Rate) / (Avg Loss * Loss Rate), where the Rates are %ages (or decimals)... if PF > 1 you profit ..clearly a system with a low Win/Loss ratio can be profitable with sufficient Win Rate
did you say you sum all your MAE's & MFE's tho? Looking at the maximum datapoint would speak of risk but a summation would give the same information as an average.. perhaps I misread.
As you can tell I'm trying to digest this stuff as I go along. Anyways when Phillip said: "The difference between MFE and the OrderProfit is something I call "excess MFE" or simply "EMFE" and this is money that you left on the table by virtue of your exit strategy keeping the position open too long."
If I have 2 orders. Showing:
Order#1) Mfe=200, Profit=100, Mae=0
Order#2) Mfe=0, Profit=-50, Mae=-100
I couldn't just use one particular order and averaging would be mis-leading (that would be more appropriate for a single order). Well looking at it now, one could do the same math in a row, but you still have to sum it up to create the effect I wanted. Being in Excel had me thinking more in columns. By summing I mean I added the Mfe's 200+0 to get 200. And Mae's 0+-100 to get -100 and Profit of 50.
Mfe 200 - Profit 50= Excess Mfe 150 ...{We want small number here}for ideal
This is 150-pips I could have kept. This may signal the use of trailing stops or some other exit modifications to the strategy. I hate leaving money on the table. No pun intended. ;)
Mae -100 + Mfe 200= Undermined 100.{We want big number here}for ideal
Phillip said: "I characterize MAE as MAE is telling you that your "entry strategy" got you into a position too early, by an amount equal to the MAE. As such your "Profit potential" for the trade was undermined by an amount equal to the MAE."..."MAE is for tuning your entry strategy. MFE is for tuning your exit strategy."
Here I trying to get the undermined values.
Zen-Mxe = Excess Mfe 150 {divided by} Undermined 100. = 1.5 {We want small number here}for ideal
Zzuegg noticed that ideal Mae would be 0. And ideal Mfe would equal Profit. With that light-bulb on, I created the Zen-Mxe.
Phillip said: ....optimization to tune the entry and exit strategies for minimal MAE and minimal EMFE. I translate as meaning Mfe closer to 0. And Excess Mfe closer to 0.
If you're mathematically inclined, you may see the relationships in other formulas like PF. Or you may have an easier method of arriving at your answers. I on the other hand need to go through this to conceptualize the math. As for your approach, sounds interesting and I'll consider adding to my tool box. I'll think about it right now.....
So we take the Mae of the 2 trades. 0 and -100 and average it. That would be -50. So then maybe we can take this as the optimization target. Because no system is perfect enough to get 0 & 0. Ah.. there, we have another criterion to our trader's tool box. :). Sorry I don't have enough samples or variances of samples that one trade is Far off from the rest of the trades so that you could drop it off the calculations. I would be a little uncomfortable thinking my system have a Mfe of 50 or even typical loss of 50 when the real stop-loss goes as far down as 300.
When you use Phillips tool it generates Frequencies which would be helpful in your assessment. I still need to play some more with that tool so I can understand better how time-to-mae/mfe works. Thats my next step.
Ok, I fixed the logical error Zzuegg alluded to earlier and ran the default in fixed 0.1 pips.
Default: in_Pips
Mfe 2700 - Profit 977= Excess Mfe 1723
Mae -1272 + Mfe 2700= Undermined 1428
Zen-Mxe 1.20
The Zen-Mxe is the lowest value yet but comes at no surprise because the it's being compared to blind time close. It narrowly beat out the 24-hour close. Appears to me that in general the longer this system is allowed to run the lower the Zen-Mxe which would indicate that it's more of a long term system as indicated by the original provider.
Time-to-Mae/Mfe Next..... Updated
373.4833333 0.02
853.4833333 0.02
1693.483333 0.02
1873.483333 0.02
11653.48333 0.02
133.4833333 0.04
253.4833333 0.04
613.4833333 0.04
193.4833333 0.08
73.48333333 0.14
13.48333333 0.56
Time2Mae= 17728
493.4833333 0.02
733.4833333 0.02
853.4833333 0.02
1213.483333 0.02
1453.483333 0.02
1693.483333 0.02
3013.483333 0.02
5353.483333 0.02
9733.483333 0.02
373.4833333 0.04
433.4833333 0.04
673.4833333 0.04
913.4833333 0.04
253.4833333 0.06
73.48333333 0.08
133.4833333 0.08
193.4833333 0.08
13.48333333 0.36
Time2Mfe= 27602
Time2Mae is clearly < Time2Mfe. Tho, all my report numbers seem to be larger then expected. In this case it's the relativity which matters, so I'll move on til Phillip can explain some of this.
Now that the Time-2-Me checks out. I'm going to experiment with some Exit conditions which might improve the Emfe. The 1st thing which comes to mind is Trailing-Stop. Yep, it's time for that Break-Even stop to make way for something more dynamic. Then we'll also try BarrowBoy's Atr-Stoploss found here. Yep, BB I'm dragging you into this :) hope you don't mind. For those who don't know who, he's one of our Moderator. And Last but not least Zzuegg's Accelerated Ma found here. 8P Oh, and I taught about 2 more. Since the stop-logic started with previous 5-bar low why not keep that trend going. And, one of my own, Envelopes :) hope you like the mail man.
To preserve some of the Psychological easing and original logic, I'm going to trigger the trailing-stops after it set the break-even.
*Undermined is my attempt at Phillips undermine concept. (higher=better) if undermined is negative, one might consider reversing the signals.
*Excess Mfe is my attempt at Phillips EMFE concept.
*Zen-Mxe is the EMFE / Undermined. I dub thee a new Criterion. 8)) just kidding. (lower=better)
Default is the program as it was originally written. A comparison between Default and the Timed Close would not be accurate because Default is values in $$ and have variable lot sizes. Where as the rest are 0.1 sizes.
Hi ubzen, I think there might be some misunderstanding involved here. Rather than dive into your posts to try and understand precisely where/how the misunderstanding is coming from I think it would be better use of my time if I just further expand on my prior post in the thread and attempt to clarify what it is I was talking about. If such clarifications support your statements then that is great, if they run counter to your understanding and statements then you will be best to recognize this long before I will.
"Undermined" means your Profit for the trade could have been higher by an amount that is up to the value of the MAE had your entry strategy delayed opening the trade. You are getting into the trade too early at too high (if bull trade) of a market price. Had your strategy held out longer before opening the position then your entry price would have been lower, meaning more profits for you in the end.
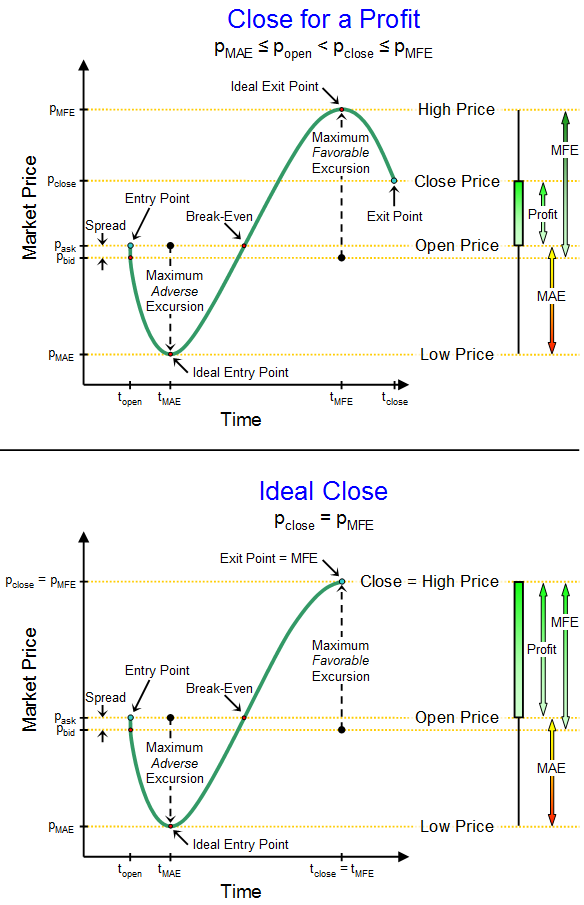
Take a look at the difference between the top and bottom diagrams:
The difference is that the entry strategy is different and because of this the profit (right hand side of the chart) is larger for the bottom trade than the top trade. The dollar value of the MAE is telling you how much more money you had the opportunity to make on the exact same trade had your entry strategy been better at predicting/timing the local market bottom in price action. (and vice-versa if you are looking at a short position)
When I run a backtest I average all the MAE's together and I look for strategies that have the lowest overall average MAE as this is an indication that those entry strategies are doing a better job at predicting/forecasting/timing the market for opportune entry points.
This analysis of the MAE is done completely in the absence of the MFE values. Entry and exit strategies are treated as two totally separate aspects of an overall trade strategy when it comes to characterizing their efficacy at predicting/timing opportunities to get into the market as well as getting out of the the market.
While we use the average MAE value to search for optimal entry strategies (and parameters) we look to the average EMFE to to search for optimal exit strategies.
We are looking for strategies that have the smallest average MAE and smallest average EMFE as these strategies are doing the best job at being predictors of when to get into the market and when to get out of the market.
That said, of course we don't want strategies that are waiting so long to get into the market and are then jumping back out of the market prematurely such that we have small average MAE and small average EMFE but also small total profit.
The simple way I filter for this is I have sorting/filtering criteria. I run a backtest, I have a csv file that gets updated at every deinit() with the resultant average MAE and average EMFE values for that specific trade parameter combo as well as the average profit per trade. The csv file is only updated if the average MAE, average EMFE, and average profit/trade all meet a minimum threshold.
An example might be something like "average MAE must be no more than -$100, average EMFE must be no more than +$100, and average profit per trade must be no less than $200". Just an example.
Then I will rank-sort the resulting data by profit per trade and seek out the maximum profitable trade strategy.
Now my downselection criterion is actually a little more complicated than that because I don't really use "gross profit" as a metric of success. I look for strategies that have the best RAROC (risk-adjusted return on capital).
This involves computing the probability of losing 50% of the account (median drawdown) and normalizing (risk adjustment) the ROI such that the result risk of ruin is that I have a 1% chance of losing 50% of the account's equity (so-called 1%/50% rule, some people are even more conservative and go for 1%/20%). Once I have this data I can them compute the RAROC and rank-sort the output of RAROC.
What you will find is that strategies which have inherently low average MAE and inherently low average EMFE will also be inherently more profitable (for all the obvious reasons) and will thus inherently have higher RAROC. It all comes together nicely.
Theres a lot of talk about MAE/MFE ..M for Maximal... but are there any attempts to single out outliers? ..for instance, a particular trade may have moved 300 pips in the adverse direction before turning a profit while most trades only move around 50.. would an mAE/mFE .. m for mean, be more descriptive?
If you are using the code I uploaded last summer I believe it contains the outlier identification procedures (per WECO rules) and purges outlier trades from the analysis. Honestly the code from last year is so old though I can't remember whether I updated it with this logic that long ago or if it was a more recent addition. Also, at some point I made the excursion filtering a user-selectable option in the call function. So it may be present in that code from last year but it may be disabled if the user is not enabling it when they call it.
The M is for maximal but it is Maximal per trade, not Maximal for a basket of trades. And naturally the standard deviation of the MAE's and EFME's is relevant as well.