Press review - page 310
You are missing trading opportunities:
- Free trading apps
- Over 8,000 signals for copying
- Economic news for exploring financial markets
Registration
Log in
You agree to website policy and terms of use
If you do not have an account, please register
INR to USD forex rates today: Rupee falls 21 paise at 4-month low against USD in early trade (based on india.com article)
Extending losses for the third consecutive day, the rupee shed 21 paise to hit a four-month low of 63.77 against the US dollar in early trade today at the Interbank Foreign Exchange due to continued demand for the American currency from importers. Forex dealers said sustained demand for the dollar from importers mainly weighed on the local currency but a higher opening in the domestic equity market and easing dollar against other currencies overseas, limited the rupee’s losses. The rupee had lost 24 paise to close at a fresh three-and-half month low of 63.56 against the US dollar in the previous session on Friday.
Meanwhile, the benchmark BSE Sensex rose by 129.34 points, or 0.47 per cent, at 27,567.28 in early trade
A Goldman Sachs EUR/USD Elliot Wave view (based on forexlive article)
"The market came close to testing 1.0911-1.0914 - 76.4% retrace of the Apr. 6th/13th drop and 76.4% of the swing target from Apr. 13th:
"If this is truly a wider/extended triangle, then it suits the underlying view that there is still one last leg lower to complete the 5-wave decline
Trading the News: U.K. Gross Domestic Product (GDP) (based on dailyfx article)
The U.K.’s 1Q Gross Domestic Product (GDP) report may dampen the appeal of the British Pound and undermine the near-term rebound in GBP/USD as the growth rate is expected to increase an annualized 2.6% after expanding 3.0% during the last three-months of 2014.
What’s Expected:
Why Is This Event Important:
Threats of a slower recovery may encourage the Bank of England (BoE) to adopt a more dovish tone while delivering its quarterly inflation report on May 13, and the central bank may look to further delay its normalization cycle in an effort to stem the downside risks surrounding the region.
Nevertheless, the ongoing improvement in the labor market paired with the rebound in business outputs may generate a positive development, and an unexpected pickup in GDP may spur a larger advance in British Pound as it boosts interest rate expectations.
How To Trade This Event Risk
Bearish GBP Trade: U.K. GDP Slows to Annualized 2.6% or Lower
- Need red, five-minute candle following the GDP print to consider a short British Pound trade
- If market reaction favors bearish sterling trade, short GBP/USD with two separate position
- Set stop at the near-by swing high/reasonable distance from entry; look for at least 1:1 risk-to-reward
- Move stop to entry on remaining position once initial target is hit, set reasonable limit
Bullish GBP Trade: 1Q Growth Rate Exceeds Market Expectations- Need green, five-minute candle to favor a long GBP/USD trade
- Implement same setup as the bearish British Pound trade, just in reverse
Potential Price Targets For The ReleaseGBPUSD Daily Chart
GBPUSD M5: 37 pips price movement by GBP - GDP news event :
The U.K. economy expanded at a slower-than-expected pace during the last three-months of 2014 as the growth rate climbed an annualized 2.7% following a 2.6% rise in the third-quarter. The lackluster recovery may encourage the Bank of England (BoE) to largely retain a wait-and-see approach in 2015, but we may see Governor Mark Carney continue to prepare U.K households and businesses for higher borrowing-costs as the central bank looks for a pickup in economic activity. The initial bearish reaction was short-lived as GBP/USD pushed above the 1.5100 handle ahead of the North America trade, with the pair ending the day at 1.5165.
MetaTrader Trading Platform Screenshots
GBPUSD, M5, 2015.04.28
MetaQuotes Software Corp., MetaTrader 5
GBPUSD M5: 46 pips price movement by GBP - GDP news event
AUDIO - Weekend Edition with John O'Donnell
Historic levels for the Nasdaq usher in a wave of skepticism amongst the hosts of Power Trading radio! Merlin and John offer their perspectives on what it means to have the market at these levels and what traders should be looking at. Listeners also ask questions on zero interest rates, market crashes, and inverse market Leaps.
EUR/USD Testing Resistance (based on investing.com article)
EURUSD: Seeking the high 1.09s before down. The near-term grind higher is still on; now testing resistance at the low end of the descending 55 day exponentially weighted moving average band (1.09151.1035). While short-term dynamic support at the flat "Kijun-Sen" (1.0775) remains intact additional gains into the high-1.09s is the best fit. but once there look for near-term bearish signals to take advantage of. Current intraday stretches are located at 1.0790 and 1.0955.
Spot gold: On the lookout for a +$1,211 break. The biggest single-day gainer since late Jan must count for something.It now looks quite clear that the decline from the early Apr high of 1,224 is, or rather was,a correctional descent. All that is needed now is a +1.211 break to confirm this and to allow extension to and through resistance at 1,22426. A short-term "Equality point" hints that 1.257 is the next attraction/resistance to align aim at. Current intraday stretches are located at 1,185 and 1,209.
Brent Crude: Could recheck the $62-level before. The short-term bullish wave structure remains incomplete though it is still valid. If the recent sellers' response leads to near-term bearish initiative below mid-body support at 63.90; pencil in decline closer to dynamic support, now starting at 62.00. A sub-60.70 overlap is however not ideally wished for since it would complicate the wave count more.
S&P500: Bearish print on top. The short-term "equality point" at 2,121 held buyers at bay with sellers' response being strong there. The bearish print as a result points lower near-term (with short-term momentum indicators running at rich levels indicating an overstretch) and the ascending 8 day "Tenkan-Sen", now at 2,092, could be retested - but a buyers' response there (or no later than at 2,080) is likely. Current intraday stretches are located at 2,090 and 2,121.
EURUSD extends above next hurdle. What next? (based on forexlive article)
The EURUSD had a bit of up and down time of it as the NY session got underway, but the support level held (see earlier post) against the 1.0915-25 area.
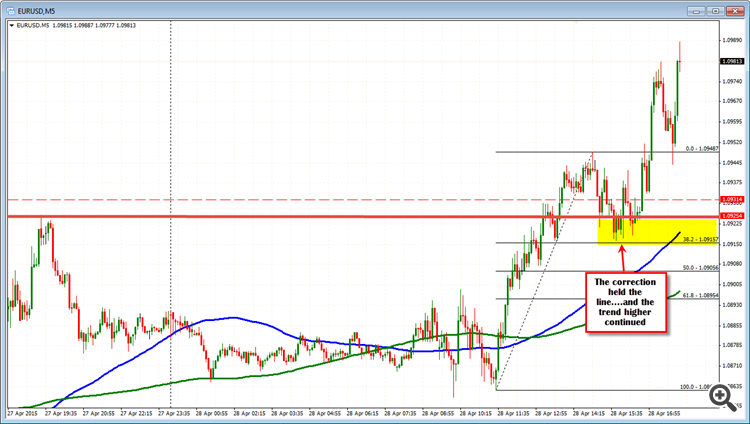
The subsequent rally has seen the price extend above the 1.0971 level (highest close since March 5th). The next target is up at the 1.1000 level and there is some early profit taking against the level (or so it seems). The natural resistance level has been breached 6 separate times over the last month and a half - each failed. The high has extended to 1.09887 so far. Real close support comes in at 1.0971. If it stays above that level, we should see a serious test of the 1.1000 level.The range for the day (was 91 pips earlier) is now at 130 pips. The average trading range over the last 22 days is 131 pips. So we have reached the average. That does not stop the market from going higher but it can make additional moves more difficult. Traders who are long, can take partial profit against the 1.1000 level. If we do get a break, however, there will likely be stops as the squeeze continues. The next target would be at 1.1025-35 area where highs from April 3 and April 9th stalled (and March 24th as well - see chart below). The high on March 25 peaked at 1.1051.
sdsd
EUR/USD Forecast April 29, 2015, Technical Analysis (based on fxempire article)
The EUR/USD pair broke higher during the course of the session on Tuesday, heading towards the 1.10 level. This is an area that we should see quite a bit of resistance at, and with the Federal Reserve having its interest-rate announcement and more importantly, the interest rate statement during the session today, it’s very likely that we will have a catalyst for the next move in this pair. Because of this, we believe that it’s only a matter of time before the sellers step in, but we recognize that a move above the 1.12 level would change everything. It is very possible that we get some type of extraordinary move during the session. We believe this move will dictate where the market goes next.
AUDIO - Financial Matters with Ara Bayindiryan
Merlin sits down with the Architect of Online Trading Academy’s new Financial matters program. They discuss aspects of everyone’s life which are impacted by money related decisions, and offer insights on how to make better, more informed decisions. Thus preserving capital, decreasing risk, and achieving financial goals.
if actual > forecast (or previous data) = good for currency (for USD in our case)
[USD - GDP] = Annualized change in the inflation-adjusted value of all goods and services produced by the economy. It's the broadest measure of economic activity and the primary gauge of the economy's health.
==========
"Real gross domestic product -- the value of the production of goods and services in the United States, adjusted for price changes -- increased at an annual rate of 0.2 percent in the first quarter of 2015, according to the "advance" estimate released by the Bureau of Economic Analysis. In the fourth quarter, real GDP increased 2.2 percent.
The Bureau emphasized that the first-quarter advance estimate released today is based on source data that are incomplete or subject to further revision by the source agency (see the box on page 3 and "Comparisons of Revisions to GDP" on page 5). The "second" estimate for the first quarter, based on more complete data, will be released on May 29, 2015.
The increase in real GDP in the first quarter primarily reflected positive contributions from personal consumption expenditures (PCE) and private inventory investment that were partly offset by negative contributions from exports, nonresidential fixed investment, and state and local government spending. Imports, which are a subtraction in the calculation of GDP, increased."
Federal Reserve policymakers see weakness in US economy (based on afr.com article)
The Federal Reserve pointed to weakness in the US labour market and economy, in a sign that the central bank is struggling to proceed with its plans to raise interest rates this year.
"The committee anticipates that it will be appropriate to raise the target range for the federal funds rate when it has seen further improvement in the labour market and is reasonably confident that inflation will move back to its 2 per cent objective over the medium term," the Fed said in its statement, following a two-day meeting of its policy-setting committee.
ECONOMY:
April: The Fed has taken a gloomier view of the economy: "Economic growth slowed during the winter months, in part reflecting transitory factors. The pace of job gains moderated ... Growth in household spending declined."
March: "Information received since the (Fed) met in January suggests that economic growth has moderated somewhat. Labor market conditions have improved further, with strong job gains and a lower unemployment rate."