Press review - page 213
You are missing trading opportunities:
- Free trading apps
- Over 8,000 signals for copying
- Economic news for exploring financial markets
Registration
Log in
You agree to website policy and terms of use
If you do not have an account, please register
Gold Miners Set To Lead The Market
Gold miners are some of the best performing assets of 2014. Not all gold miners are up big but I believe the laggards will join the leaders once gold breaks out definitively. Gold mining ETFs are at the top of the ETF ranks this year. If you plot Market Vectors Gold Miners (ARCA:GDX) or Market Vectors Junior Gold Miners (ARCA:GDXJ) against SPDR S&P 500 (ARCA:SPY) on a relative basis a key technical event is unfolding. Gold miners are starting to hold the 50 day moving average on this relative chart and the 50 day is tightening with the 200 day moving average. This is a very bullish formation and a break above the 200 day moving average would confirm leadership in the stock market for the gold stocks.
Gold Takes A Dive On Upbeat US Consumer Confidence Report
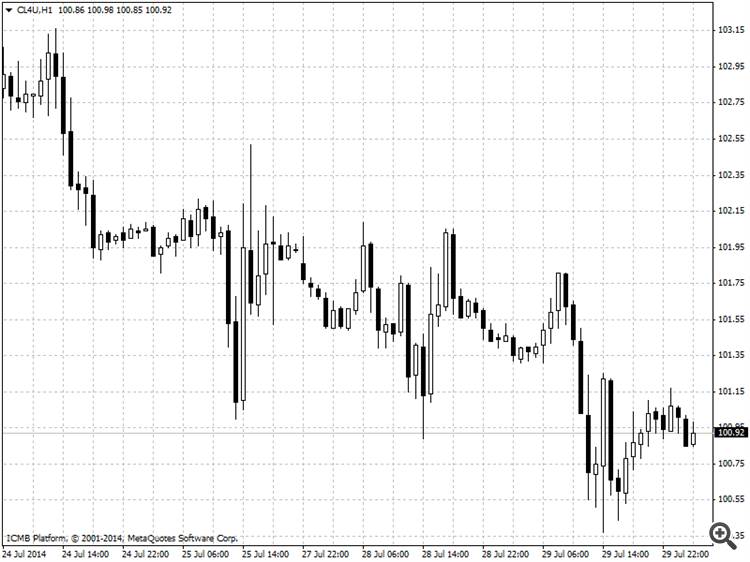
Crude Oil
U.S. crude futures dropped on Tuesday amid concerns that this week's supply data will depict a U.S. economy that is awash in crude. Crude futures drop on U.S. supply concernsSupply concerns offset geopolitical events, upbeat U.S. data and pressure oil prices lower The American Petroleum Institute will release its inventories report later in the day, while Wednesday’s government report could show crude stockpiles fell by 1 million barrels in the week ending July 25. Despite concerns that conflict in Ukraine and across the Middle East may disrupt supply, shipments have continued to flow normally, with sentiments that the U.S. is brimming with crude oil often overshadowing upbeat U.S. data. The Conference Board reported earlier that its consumer confidence index rose to 90.9 in July from an upwardly revised 86.4 in June. It was the highest reading since October 2007, defying consensus forecasts for a decline to 85.3.
GoldGold prices dropped in U.S. trading on Tuesday after an upbeat consumer confidence report sent investors betting that the Federal Reserve will deliver an positive take on the U.S. economy at a policy meeting this week and make fresh cuts to its stimulus program that has supported the yellow metal for years. Gold takes a dive on upbeat U.S. consumer confidence report, Gold drops as cheery U.S. consumer confidence report fuels bullish Fed expectations Data released earlier bolstered the dollar and in turn, pushed down gold, as the two assets tend to trade inversely with one another. The Conference Board reported that its consumer confidence index rose to 90.9 in July from an upwardly revised 86.4 in June. It was the highest reading since October 2007, defying consensus forecasts for a decline to 85.3. The data sent investors betting that the Federal Reserve will conclude a policy meeting on Wednesday announcing fresh cuts to its monthly bond-buying program and deliver an upbeat take on the U.S. economy.
GBPUSD
Should price action for the GBPUSD remain inside the 1.6930 to 1.6960 zone the following trade set-up is recommended:
Should price action for the GBPUSD breakout above 1.6960 the following trade set-up is recommended:
Should price action for the GBPUSD breakdown below 1.6930 the following trade set-up is recommended:
Other Currencies Emerge As An Alternative To USD, Gold Benefits
Last week, the main drivers behind the gold prices were the situation of the Malaysian Airlines jet downing in Ukraine and Israel’s invasion of Gaza. For now it seems that the other hot-spots especially those in Syria, Libya and Iraq have been temporarily forgotten.
On Thursday, gold prices fell on Comex once again, in what was yet another bout of concentrated selling on two occasions. It is estimated that $1 billion worth of gold futures were sold in a matter of seconds on the open of the market. However, despite posting an overall decline for the week, the price of gold rebounded strongly on Friday even though the US dollar gained against most of the other major fiat currencies. At the time of writing, the price of spot gold is trading above $1310 an ounce.
As Western media continue their propaganda regarding current geopolitical tensions, little attention has been paid to some major events that are developing in the global monetary system. And, while the U.S, and the European leaders impose more sanctions on Russia, their very move is prompting Russia to reduce its dependence on the US Dollar.
Last week, U.S State Department spokeswoman Marie Harf gave the press atruly comical performance. After blaming Russia for the Malaysian air disaster and claiming the U.S. has evidence that Russia intends to deliver powerful rocket systems to pro-Russia rebels in Ukraine, Ms. Harf declined to provide details about the systems or about how that conclusion was reached. And, when questioned by Associated Press journalist Matthew Lee over how the conclusion was reached, she attempted to ignore his questions and instead asked for other questions. But, Lee politely demanded a response.
“Marie, I think that it would be best for all concerned here, if when you make an allegation like that you’re able to back it up with more than just ‘Because I say so,” Mr. Lee said.
Ms. Harf disagreed with the assertion: “That’s not what I said. It’s based on intelligence information. It’s not because I said so.”
Recently, a meeting between the leaders of the BRICS countries resulted in an agreement on a new financial system and currency pool.
BRICS is the acronym for an association of five major emerging national economies. Brazil, Russia, India, China, and South Africa. The grouping was originally known as “BRIC” before the inclusion of South Africa in 2010. The BRICS members are all developing or newly industrialised countries, but they are distinguished by their large, fast-growing economies and significant influence on regional and global affairs; all five are G-20 members.
As of 2013, the five BRICS countries represent almost 3 billion people with a combined nominal GDP of US$16.039 trillion and an estimated US$4 trillion in combined foreign reserves. As of 2014, the BRICS nations represented 18 percent of the world economy.
Brazil is a large country, but it is a relatively poor nation.
While Russia is rich in oil and natural gas, it does not have much else going for it, and its economy is still quite small in comparison to the United States.
Although India has a population of well over 1 billion, it is a relatively poor country, plagued with bureaucratic regulations and a terrible currency. However, it is the second largest importer of gold in the world.
On the other hand, China is fast becoming a force to be reckoned with. The developments that have taken place there in the last 35 years have been astonishing, resulting in one of the greatest gains in wealth in history over such a short time span. Hundreds of millions of people have been lifted out of extreme poverty.
As for South Africa, there is not much to say. While Western leaders applaud the country for its so called democracy, they fail to mention that nation has one of the most corrupt governments in the world and the country is plagued with crime. Armed robberies, housebreaks, hijackings, murder and rape occur on a daily basis. Electricity prices are one of the highest in the world and so is the unemployment rate. Property rights have been weakened there, and the country is quite insignificant in global economic matters. And, South African leaders seem to know nothing about wealth creation and are more intent on the redistribution of wealth instead of the production of wealth.
Perhaps, South African leaders should take a lesson from Adam Smith who outlined in his book the Wealth of Nations how great empires depend on an educated, productive and prosperous citizenry. Or they should follow the policies of successful countries such as China, Singapore and United Arab Emirates instead of emulating the ideologies of leaders such as Robert Mugabe of Zimbabwe or Hugo Chavez of Venezuela. Nevertheless, what is significant about the BRICS nation is that they have established a new development bank and a reserve fund set up to offset financial crises.
The BRICS Development Bank – with an initial US$50 billion in capital – will be not only BRICS-oriented, but invest in infrastructure projects and sustainable development on a global scale. The model is the Brazilian BNDES, which supports Brazilian companies investing across Latin America. In a few years, it will reach a financing capacity of up to $350 billion. With extra funding especially from Beijing and Moscow, the new institution could leave the World Bank in the dust.
And then there’s the agreement establishing a $100 billion pool of reserve currencies – the Contingent Reserve Arrangement (CRA), described by Russian Finance Minister Anton Siluanov as “a kind of mini-IMF”. That’s a non-Washington consensus mechanism to counterpunch capital flight. For the pool, China will contribute with $41 billion, Brazil, India and Russia with $18 billion each, and South Africa with $5 billion.
Since its first summit in Ekaterinburg, Russia in June 2009, BRICS has grown into what it is today: an increasingly consolidated geopolitical alliance of powerful countries bent on neither allowing the Western powers to call the shots in today’s world, nor to threaten them. Furthermore, it will not allow the West to impose its currencies, and its debt-based economic philosophy on everybody.
Meanwhile, China continues to develop the yuan into a global currency. Only last month China's central bank said it plans to designate clearing banks for its currency in Paris and Luxembourg, as the two financial centres battle with London to become the leading European offshore yuan-trading city.
The French and Luxembourg central banks have signed agreements with the PBOC allowing for greater cooperation in the oversight of their domestic yuan market. Also, Singapore and Sydney are also vying for a significant share of the global yuan market, which is expected to expand rapidly along with China's fast-growing economy.
In addition to designating a clearing back in London earlier this month, the PBOC also announced on June 18 that the yuan can now be exchanged directly for British pounds in Shanghai's foreign-exchange market. Previously, traders have had to exchange the currencies through the U.S. dollar, which added to transaction costs.
In 2013, yuan foreign-exchange trading in London reached $25.3 billion a day, up 50% compared with 2012, according to data released earlier this month.
China's currency has become increasingly popular in settling total trade. In the first three months, 18% of China's total trade, or 1.09 trillion yuan, was paid for in yuan, up from 14% in the fourth quarter of last year, according to Bank of China. That compares with just 1% of China's total cross-border trade five years ago.
For the long term, China wants to turn the yuan into a global reserve currency that is used for investment, trade and loans, as are the dollar and euro. A widely accepted yuan could help Chinese companies alleviate foreign-exchange risks. We may even see a gold backed yuan!
The result of these developments will ultimately reduce the hegemony of the US dollar which in turn will lead to a loss of faith in the greenback. But, in addition to this, I expect geopolitical tensions to deteriorate in the coming months. This will prompt Western governments to further debase the major currencies of the world and destroy the wealth of the middle class.
The end game will be an economic collapse and the destruction of our current monetary system. However, countries and individuals that have reduced their dependence on fiat currencies and have followed a policy of sound money that includes holding physical gold will survive this coming crisis.
Silver Stuck In Descending Wedge
The silver market can be rather confusing for a lot of traders, but there is hope that it’s not too hard to understand as it bounces around on technical patterns on the chart.
Source: Blackwell Trader (Silver, D1)
After a strong touch on the bearish trend line silver has looked to range back downwards in a descending wedge, and that’s not surprising given that markets are starting to look up at the U.S dollar. All forecasts this week are expected to show positive results for the U.S economy, whether that is actually true remains to be seen. But, it’s a positive sign when forecasters are looking forward with some optimism.
So with a descending wedge, it generally means that we will see a bullish breakout higher at some point. Currently the market is at 20.57 and further lows look very much possible. I am targeting the 20.04-19.73 area which has shown in the past to be a turning point with high volume and liquidity in the market. Traders will be looking to target this area as well.
Movements lower though could struggle if U.S. data is weaker than expected, however, the current trend line will likely trap movements higher in the event of weaker U.S. data.
Overall, bearish sentiment remains in the short term until we get below the present 20.00 dollar an ounce mark, and strong U.S. data will help extend this push lower. A strong non-farm reading might even push it completely into the range we are targeting and in turn help provide a breakout of the present descending wedge.
Gold Bounces, Dollar Strength Continues
Gold bounced around in the range defined by the 20 DMA at the top and the 50 DMA at the bottom yesterday, as the "summer doldrums" type trading continues. This is typified by choppy sideways trading with a downwards bias and narrow trading ranges and is usually seen in July/August as the markets wind down for the holiday season.
The market is well supported around $1287-$1292 on the down side - a break of this level will see an escalation in the decline with $1274 our initial target.
The dollar strength continues, with the rally taking the dollar well above 81, this is bearish for gold and is a major factor in the recent price weakness. Equities near to all time highs add to the overall bearish picture for gold.
Support can be found at $1299-$1301, $1292, $1285-$1287, $1263, $1257-$1260, $1250-$1252, $1237-$1240, $1220-$1225, $1210, $1200 and $1180. A break of $1$180 would have serious bearish implications for gold and suggest a decline to $1000-$1050 in the short term - a failure to break the 65 week MA would make this much more likely.
Resistance can be found at $1310, $1318-$1322, $1325-$1326, $1333-$1335, $1340-$1342, $1352-$1354, $1392-$1395, $1400, $1420 and $1435. We appear to be witnessing a second failure to break through the key 65 week MA - this would suggest that the intermediate down trend is intact and a retest of $1240 and possibly $1$180 is likely.
Gold And Crude Consolidate Ahead Of Tomorrow’s Fed Meeting
Gold and crude prices narrow traded in New York ahead of tomorrow’s Fed meeting after that the gold plunged earlier today as U.S. and European equities advanced, curbing demand for the precious metal as an alternative asset and that oil fell to a two-week low on concern that the shutdown of a Kansas refinery will reduce crude demand.
Otherwise on geopolitics, Investors were kind of spooked by the new round of sanction against Russia, which came on the heels of the crash of Malaysian jet over Ukraine, killing 298 people on board.
The US and European Union leaders agreed on Monday to extend sanction on Russian business, defense and energy sectors.
In Gaza, the fighting continued between the Palestinian militant group Hamas and Israeli defense Forces (IDF), one day after both parties announced a new 24-hour ceasefire on Monday.
Also today the country’s consumer confidence, which is released on a monthly basis, assessing consumer sentiment regarding business conditions, employment and personal income rose to the highest level since October 2007.
In fact the New York-based private research group revealed today that the Conference Board’s index of U.S. consumer confidence increased to 90.9 in July from 86.4 a month earlier; above the market projected reading of 85.5.
Accordingly the gold is so far trading around $1298.80 an ounce recording a high of $1312.00 ounce and a low of $1295.95 an ounce and crude is trading around $101.00 a barrel recording a high of $101.80 a barrel and a low of $100.38 a barrel.
China, The S&P 500 And The Unbroken Road
The Chinese market has been gaining attention lately. The Shanghai Composite broke a range and has been rocketing higher the past week, but the China ETF - iShares FTSE/Xinhua China 25 Index (ARCA:FXI) has been running hot since early May. And what about the S&P 500? It has periodically made new higher highs but over the past month is moving slowly and drifting higher. Many think a correction is coming soon. Maybe it will maybe it wont.
But with a big shift in China and leveling at least in the US one tend has not changed at all for 5 years. The Ratio of the Chinese Market to the S&P 500 has been in a downtrend since July 2009. Think about how much has happened over that time frame. Wars, ethnic uprisings, currency crises, default threats. At least 2 or each! and look at the ratio chart below. It just keeps going lower. Flows from China to the US. Yes it is in an upswing at the moment, but it has a lot of room before it challenges the top of the falling channel.
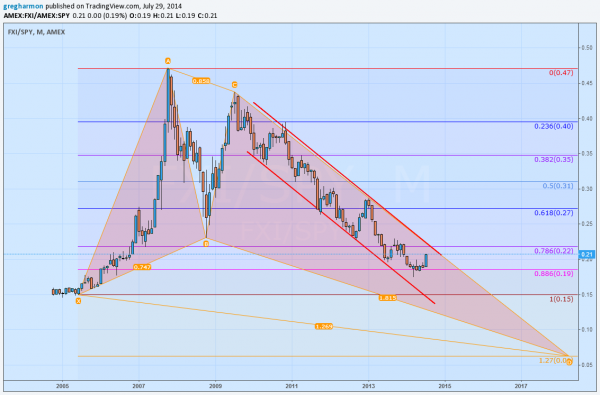
Fibonacci aficionados will notice that the channel has retraced 88.6% of the move higher. So a reversal could come. But many would expect a continuation towards a full retracement. Harmonic traders will see a Bullish Butterfly playing out. But that pattern looks for a continuation lower to the bottom of the triangle before reversing.You don’t have to believe in Fibonacci’s or Harmonics. But you cannot ignore that the trend lower, from China to the US, remains unchallenged. Until that changes there is really no reason for you to look to move assets out of the US to bet on a Chinese Market recovery.
Disclosure: The information in this blog post represents my own opinions and does not contain a recommendation for any particular security or investment. I or my affiliates may hold positions or other interests in securities mentioned in the Blog, please see my Disclaimerpage for my full disclaimer.
Twitter Crushes Earnings: What Happens Now?
Twitter (NYSE:TWTR) released its results for the second quarter and took the Street by surprise, sending shares up 28% after hours. Excluding the effects of share dilution from stock-based compensation–a major bugbear of mine–Twitter turned a profit of $0.02 per share.
Revenues came in at $312 million, beating the consensus estimate of $283 million by a wide margin. And the number of monthly active users (“MAUs”) rose to 271 million vs. the consensus estimate of 267 million.
That’s the good news. Now for the bad news: Twitter is still not growing anywhere near fast enough to justify its current valuation multiples.
Assuming Twitter generates something in the ballpark of $1.2 billion in revenues this year, Twitter’s stock would still be trading at 24 times sales. Again, that’s sales, not earnings. That’s even more expensive than Facebook’s (NASDAQ:FB) 19 times sales, and remember, Facebook is a vastly more profitable company. Google (NASDAQ:GOOG)–with which FB and TWTR compete for ad revenues and user time–trades for a comparably puny 6 times sales.
I gave my thoughts on Twitter to CNBC’s Ansuya Harjani:
Last week, I appeared on CNBC to discuss Facebook’s earnings, noting that while Facebook’s user growth is largely in Asia and emerging markets, its revenues come disproportionately–almost exclusively–from North America. Given that Twitter’s user base is disproportionately from outside North America, it remains to be seen if Twitter will succeed where Zuckerberg and company are not.
Another Indicator Teetering On The Edge
The Elder Impulse indicator now has four blue bars. In the past this condition has usually preceded a down turn. This is one more ancillary indicator that is stalling. Remember, tops are a process and we usually see indicators fall one at a time until they reach critical mass and cause the market to fall. We’re still a long way away from any warning from the totality of indicators I watch, but every day it seems one more caution sign appears. It’s time to make a list of stocks you wouldn’t want to hold during a down trend…and think about other methods to hedge your portfolio.
The NYSE Advance/Decline (NYAD) line is painting the largest divergence in nearly a year, but still isn’t at a critical level. As I’ve stated many times before, I don’t think the market can suffer a substantial decline unless breadth breaks down. Keep an eye on NYAD, stocks above their 200 dma, and the bullish index.