Indices Technical Analysis - page 9
You are missing trading opportunities:
- Free trading apps
- Over 8,000 signals for copying
- Economic news for exploring financial markets
Registration
Log in
You agree to website policy and terms of use
If you do not have an account, please register
Forum on trading, automated trading systems and testing trading strategies
Press review
mazennafee, 2014.07.30 14:26
Gold Bounces, Dollar Strength Continues
Gold bounced around in the range defined by the 20 DMA at the top and the 50 DMA at the bottom yesterday, as the "summer doldrums" type trading continues. This is typified by choppy sideways trading with a downwards bias and narrow trading ranges and is usually seen in July/August as the markets wind down for the holiday season.
The market is well supported around $1287-$1292 on the down side - a break of this level will see an escalation in the decline with $1274 our initial target.
The dollar strength continues, with the rally taking the dollar well above 81, this is bearish for gold and is a major factor in the recent price weakness. Equities near to all time highs add to the overall bearish picture for gold.
Support can be found at $1299-$1301, $1292, $1285-$1287, $1263, $1257-$1260, $1250-$1252, $1237-$1240, $1220-$1225, $1210, $1200 and $1180. A break of $1$180 would have serious bearish implications for gold and suggest a decline to $1000-$1050 in the short term - a failure to break the 65 week MA would make this much more likely.
Resistance can be found at $1310, $1318-$1322, $1325-$1326, $1333-$1335, $1340-$1342, $1352-$1354, $1392-$1395, $1400, $1420 and $1435. We appear to be witnessing a second failure to break through the key 65 week MA - this would suggest that the intermediate down trend is intact and a retest of $1240 and possibly $1$180 is likely.
Forum on trading, automated trading systems and testing trading strategies
Press review
mazennafee, 2014.07.30 14:27
Gold And Crude Consolidate Ahead Of Tomorrow’s Fed Meeting
Gold and crude prices narrow traded in New York ahead of tomorrow’s Fed meeting after that the gold plunged earlier today as U.S. and European equities advanced, curbing demand for the precious metal as an alternative asset and that oil fell to a two-week low on concern that the shutdown of a Kansas refinery will reduce crude demand.
Otherwise on geopolitics, Investors were kind of spooked by the new round of sanction against Russia, which came on the heels of the crash of Malaysian jet over Ukraine, killing 298 people on board.
The US and European Union leaders agreed on Monday to extend sanction on Russian business, defense and energy sectors.
In Gaza, the fighting continued between the Palestinian militant group Hamas and Israeli defense Forces (IDF), one day after both parties announced a new 24-hour ceasefire on Monday.
Also today the country’s consumer confidence, which is released on a monthly basis, assessing consumer sentiment regarding business conditions, employment and personal income rose to the highest level since October 2007.
In fact the New York-based private research group revealed today that the Conference Board’s index of U.S. consumer confidence increased to 90.9 in July from 86.4 a month earlier; above the market projected reading of 85.5.
Accordingly the gold is so far trading around $1298.80 an ounce recording a high of $1312.00 ounce and a low of $1295.95 an ounce and crude is trading around $101.00 a barrel recording a high of $101.80 a barrel and a low of $100.38 a barrel.
Forum on trading, automated trading systems and testing trading strategies
Press review
mazennafee, 2014.07.30 15:07
China, The S&P 500 And The Unbroken Road
The Chinese market has been gaining attention lately. The Shanghai Composite broke a range and has been rocketing higher the past week, but the China ETF - iShares FTSE/Xinhua China 25 Index (ARCA:FXI) has been running hot since early May. And what about the S&P 500? It has periodically made new higher highs but over the past month is moving slowly and drifting higher. Many think a correction is coming soon. Maybe it will maybe it wont.
But with a big shift in China and leveling at least in the US one tend has not changed at all for 5 years. The Ratio of the Chinese Market to the S&P 500 has been in a downtrend since July 2009. Think about how much has happened over that time frame. Wars, ethnic uprisings, currency crises, default threats. At least 2 or each! and look at the ratio chart below. It just keeps going lower. Flows from China to the US. Yes it is in an upswing at the moment, but it has a lot of room before it challenges the top of the falling channel.
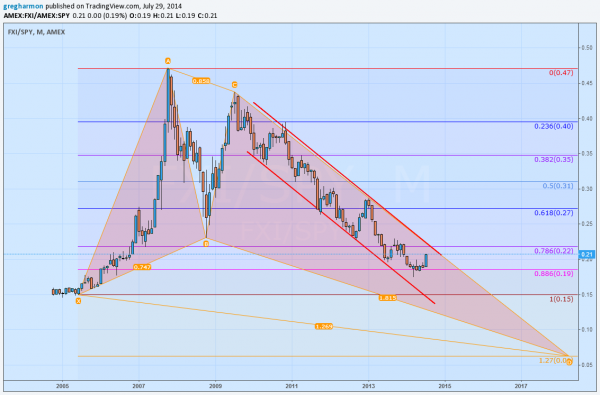
Fibonacci aficionados will notice that the channel has retraced 88.6% of the move higher. So a reversal could come. But many would expect a continuation towards a full retracement. Harmonic traders will see a Bullish Butterfly playing out. But that pattern looks for a continuation lower to the bottom of the triangle before reversing.You don’t have to believe in Fibonacci’s or Harmonics. But you cannot ignore that the trend lower, from China to the US, remains unchallenged. Until that changes there is really no reason for you to look to move assets out of the US to bet on a Chinese Market recovery.
Disclosure: The information in this blog post represents my own opinions and does not contain a recommendation for any particular security or investment. I or my affiliates may hold positions or other interests in securities mentioned in the Blog, please see my Disclaimerpage for my full disclaimer.
Forum on trading, automated trading systems and testing trading strategies
Press review
mazennafee, 2014.07.30 15:09
Twitter Crushes Earnings: What Happens Now?
Twitter (NYSE:TWTR) released its results for the second quarter and took the Street by surprise, sending shares up 28% after hours. Excluding the effects of share dilution from stock-based compensation–a major bugbear of mine–Twitter turned a profit of $0.02 per share.
Revenues came in at $312 million, beating the consensus estimate of $283 million by a wide margin. And the number of monthly active users (“MAUs”) rose to 271 million vs. the consensus estimate of 267 million.
That’s the good news. Now for the bad news: Twitter is still not growing anywhere near fast enough to justify its current valuation multiples.
Assuming Twitter generates something in the ballpark of $1.2 billion in revenues this year, Twitter’s stock would still be trading at 24 times sales. Again, that’s sales, not earnings. That’s even more expensive than Facebook’s (NASDAQ:FB) 19 times sales, and remember, Facebook is a vastly more profitable company. Google (NASDAQ:GOOG)–with which FB and TWTR compete for ad revenues and user time–trades for a comparably puny 6 times sales.
I gave my thoughts on Twitter to CNBC’s Ansuya Harjani:
Last week, I appeared on CNBC to discuss Facebook’s earnings, noting that while Facebook’s user growth is largely in Asia and emerging markets, its revenues come disproportionately–almost exclusively–from North America. Given that Twitter’s user base is disproportionately from outside North America, it remains to be seen if Twitter will succeed where Zuckerberg and company are not.
Forum on trading, automated trading systems and testing trading strategies
Press review
mazennafee, 2014.07.30 15:11
Another Indicator Teetering On The Edge
The Elder Impulse indicator now has four blue bars. In the past this condition has usually preceded a down turn. This is one more ancillary indicator that is stalling. Remember, tops are a process and we usually see indicators fall one at a time until they reach critical mass and cause the market to fall. We’re still a long way away from any warning from the totality of indicators I watch, but every day it seems one more caution sign appears. It’s time to make a list of stocks you wouldn’t want to hold during a down trend…and think about other methods to hedge your portfolio.
The NYSE Advance/Decline (NYAD) line is painting the largest divergence in nearly a year, but still isn’t at a critical level. As I’ve stated many times before, I don’t think the market can suffer a substantial decline unless breadth breaks down. Keep an eye on NYAD, stocks above their 200 dma, and the bullish index.
Forum on trading, automated trading systems and testing trading strategies
Press review
mazennafee, 2014.07.30 15:13
SPY Remains In A Chop
The S&P is still just hovering just below the important 2,000 level.
This consolidation could continue for another couple months and that would form a great bases that is needed to move above 2,000.
Looks like we won’t have too much to do still for a while but we can trade some good acting leading stocks using smaller position sizes.
Every-time I travel it’s nice to come back to the charts after a few days since it is like looking at them with fresh eyes so let’s take a look and see if there are any moves or patterns that are looking good.
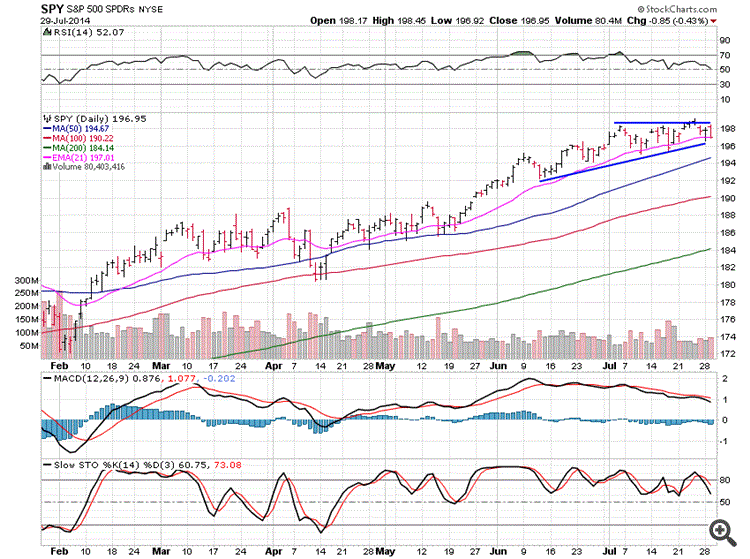
SPDR S&P 500 (ARCA:SPY) remains in a chop and will until it can break above 200 with a large increase in volume.I’d look for a break lower out of this triangle, not a huge correction, just more sideways chop.
Forum on trading, automated trading systems and testing trading strategies
Press review
mazennafee, 2014.07.30 15:16
S&P Eyes Fresh Highs On News
The S&P 500 index currently following an upward sloping wedge as the price moves north in an ever tightening band. It looks to have just bounced off the trend line and will target fresh all-time highs in the weeks to come if the US economic data stays favourable.
The earnings season in the US is a big driver of the S&P 500 index and so far it has been positive. 46% of companies in the S&P 500 have delivered results and a solid 80% of those have announced positive. This optimism had pushed the S&P 500 to an all-time high during the week, however, it pulled back late in the week as traders took profits and one or two big companies announced losses (such as Visa and Amazon). The general consensus is that the earnings season will end positively and this should help the index respect the current bullish trend line.
The big test will come later this week when the US Non-farm Payroll data comes out. The last two reports have showed strong job creation (+217k and +288k respectively) which pushed the S&P 500 index to all-time highs on both occasions. This month has a higher estimate than both of the previous two, which could put more pressure on the report if it does not excel, however, this reflects the optimism in the US at the moment and provides a good omen for US bulls.
There is plenty of other data that could buoy the S&P this week. Advance GDP later today (30th Jul 12:30 GMT) will give a good snapshot of the state of the wider economy and couldn’t possibly be worse than last quarter’s -2.9% (annualised). This round the market is expecting +3.1%, which is a massive turnaround if it comes in as expected and will no doubt boost the markets.
The Federal Funds Rate and FOMC statement also today (18:00 GMT) will give the market an idea of the current thoughts of the US Federal Reserve. The interest rate has a large impact on equities as it creates demand based on the yield differential. Equities have been on a dream run partly because the interest rate means borrowing costs for investment are low and also because equities yield more than deposits. Interest rates are expected to stay at 0.25% and Quantitative Easing is expected to be scaled back by another US$10b. Any hawkish talk from the FED will negatively affect equities as there will be less cash to boost asset prices, however FED Chairwoman Janet Yellen is seen as dovish so do not expect any hard talk this time around.
The S&P 500 is likely to keep a very close eye on the economic calendar along with the remaining companies yet to report earnings. The consensus is for more positive data and if that is the case look for the bullish channel to hold firm and the all-time highs to be tested. Beware, as all of this news will increase volatility, which could knock out stop losses before the party begins.
Forum on trading, automated trading systems and testing trading strategies
Press review
mazennafee, 2014.07.30 15:19
Month-End S&P Knock Down
Funds typically mark up stocks on the last day of the month and through the first three days of the new month. Ahead of that, we often see strong liquidation as well as buying at the lows. That’s what we saw today, though the move was unusually strong with index arbitrage sell programs dominating the falloff after the morning rally.
The MiM showed a strong sell of over half a billion and the MOC turned out to be a full $1 billion. That points to a lot of liquidation of positions by big players, with the index arb following along to take advantage of the premium.
The S&P rallied from the pre-open and reached a high just shy of 1980. After that, it was major selling all the way down to a trendline which marked yesterday’s low as well.
In this kind of market, it’s important to pivot and not hold for too long. We were buyers at the open, then sellers for most of the day. The low will be a great place to look for a buying opportunity tomorrow.
HIGH: 1979.50 Mid-Morning
LOW: 1964.50 Just Now
LAST: 1965.90 DOWN 7 Handles
TOTAL VOLUME: 1.4mil minis; 4.2k bigs
MOC: SELL $1 BILLION
U.S. and Europe imposing new sanctions.
FOR TOMORROW:
Things start to warm up starting tomorrow
MBA Purchase Applications
ADP Employment Report
GDP
EIA Petroleum Stats Report
7yr. Note Auction
FOMC Announcements
They usually mark stocks up on the last and first 3 days of the month.
Early rally – saw the highs – didn't think they could sell off so hard – big time index arb sell programs.
Sold em today, buy em back tomorrow.
Forum on trading, automated trading systems and testing trading strategies
Press review
mazennafee, 2014.07.30 15:20
Will CME Group Miss Q2 Earnings On Lower Volumes?
Global futures exchange CME Group Inc. (NASDAQ:CME)) is scheduled to release second-quarter 2014 financial results before the opening bell on Jul 31.
In the last reported quarter, the company posted break-even results, although the four-quarter trailing average beat is pegged at 0.5%. Let us see how things are shaping up for this announcement.
Factors at Play
CME Group’s average daily volumes fell 12% year over year in the second quarter due to lower rate per contracts and sluggish volatility. Trading volumes account for a substantial portion of transaction fees revenues, a major revenue driver for the company.
Alongside, higher operating and interest expenses as well as capital expenditure are likely to adversely affect operating margins, which has been below the historical average of +60% over the last several quarters.
Moreover, risks from OTC markets and lack of any significant growth catalyst amid stiff competition and stringent regulations pose operational and financial risks. Alongside, a weak capital market and limited fund resources have compelled CME Group to delay its current share repurchase program, although dividend payouts continue to retain investors’ confidence.
Earnings Whispers
Our proven model shows that CME Group is unlikely to beat earnings as it lacks the required combination of two key components.
Zacks ESP: CME Group has a negative Zacks ESP. That is because the Earnings ESP, which represents the difference between the Most Accurate estimate of 79 cents per share and the Zacks Consensus Estimate of 80 cents, is -1.25%.
Zacks Rank: CME Group has a Zacks Rank #4 (Sell). We caution against stocks with Zacks Rank #4 and 5 (Sell-rated stocks) going into an earnings announcement.
Other Stocks to Consider
Here are some other financial companies you may want to consider as our model shows they have the right combination of elements to post an earnings beat this quarter:
Qiwi Plc (NASDAQ:QIWI) has Earnings ESP of +4.76% and a Zacks Rank #1 (Strong Buy).
United Insurance Holdings Corp. (NASDAQ:UIHC) has Earnings ESP of +2.33% and a Zacks Rank #1.
Lazard Ltd. (NYSE:LAZ)) has Earnings ESP of +1.59% and a Zacks Rank #2 (Buy).
Forum on trading, automated trading systems and testing trading strategies
Press review
mazennafee, 2014.07.30 15:24
Caterpillar’s Stock In Trouble?
Last week, Caterpillar (NYSE:CAT) reported earnings that sent the stock gapping below its 50-day moving average (DMA) with a 3.1% loss. The stock followed its lower-Bollinger Bands ® (BB) until today (July 29, 2014). The stock rallied earlier in relative out-performance to the market before fading to flatline.
All this might be rather unremarkable EXCEPT this is the fourth time this year CAT has closed below its rising 50DMA. The last two were in quick succession. This trading action suggests CAT’s primary uptrend at the 50DMA is in trouble. A retest of 200DMA support is likely on the near horizon at this rate. CAT broke out above tis 200DMA back in December, 2013 and has not looked back ever since, so a 200DMA retest will be a must-watch.
Caterpillar breaks down again – is the fourth time a charm?
After the post-earnings breakdown, I thought I lost a chance for a good entry point to get put options on CAT. So, I rushed to fade CAT as it approached its 50DMA today. I purchased the Sept 105/100 put spread figuring $100 is a good downside target for even a modest sell-off in the market. As a reminder, I find bearish bets on CAT to be a good hedge against the potential for a market sell-off. Since August and September tend to be the weakest months of the year, I think now is a great time to put on this hedge.
The good folks at StockTwits are evenly split on CAT, but sentiment is notably down from a month ago. That seems to me a large enough non-confirmation of CAT’s recent highs given how well StockTwits folks seem to crowdsource opinion on stocks (that’s an informal/anecdotal observation that I would LOVE to study with hard data – Howard Lindzon, are you listening?).
A 50/50 split in sentiment on StockTwits
Be careful out there!
Full disclosure: long CAT shares and put spread