Press review - page 190
You are missing trading opportunities:
- Free trading apps
- Over 8,000 signals for copying
- Economic news for exploring financial markets
Registration
Log in
You agree to website policy and terms of use
If you do not have an account, please register
Forum on trading, automated trading systems and testing trading strategies
Discussion of article "Several Ways of Finding a Trend in MQL5"
newdigital, 2014.06.25 20:45
How to detect forex trends
Detecting a trend is an important part of predicting direction in a currency pair. Tomorrow’s prices usually follow or continue today’s trend. There will, of course, be reversals and ranging behavior within the trend but it is easier to trade with a known trend than to predict when it changes. The task of the forex trader is to detect variations or waves of sentiment. The trader needs to ask: is there a shape to changes in sentiment and can it be detected? To answer this question, we can turn to price break charts (also called three-line break charts). In recent months, Bloomberg Professional stations added these charts. They also are available in many retail charting programs such as eSignal and ProRealTime.
Price break charts show only a new high close or a new low close. For example, if a trader using a candlestick chart of a daytime interval converts it to a three-line price break chart, he would see the price action from a different vantage point. The price break chart would only show consecutive new day high closes, or consecutive new day low closes. If no new high or new low is reached, then no additional bar would appear. But when the price reverses, it shows a new column only if the price reverses three previous highs (downward reversal) or three previous lows. This is why it is called a three-line break chart. The conditions for a bullish and bearish reversal are easily identified.
Three-line break charts enable significant insights into the shape of sentiment in the price action. A trader can detect the prevailing sentiment, how strong it is, whether a change in sentiment has occurred and project where the next trend reversal will occur. Several examples of using the three-line break as an indicator occurred in the GBP/USD pair in 2009 (see “Show me the move”).
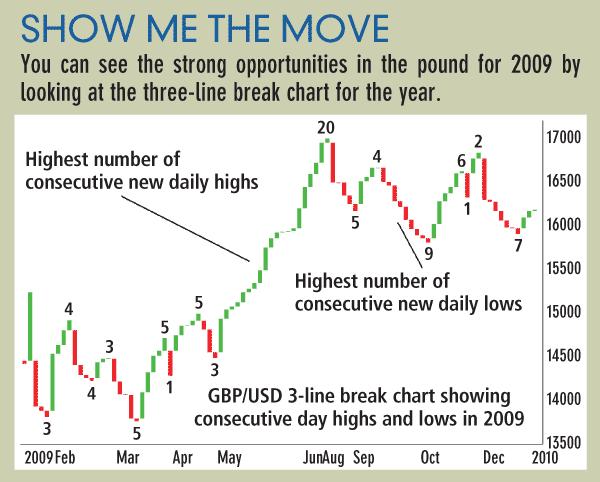
The year started with a series of three consecutive new lows. It then reversed to a distance of four new consecutive highs. The sequence reversed back to four new consecutive lows followed by three consecutive new highs. In April, we see a very significant sentiment event, a flip-flop. This is a new downward reversal followed immediately by an upward reversal. In other words, market sentiment did not continue into a series. When a flip-flop occurs, it is rarely followed by another immediate reversal and therefore is a signal that the trend direction after the flip-flop will continue for a longer distance. This is exactly what occurred. The GBP/USD flipped from a low of 1.4252 on March 30 to a high of 1.5002 on April 15.
Also in the pound, we see a long sequence of 20 new consecutive day highs that occurred between May 1 and June 11, taking it from 1.4490 to 1.6598. While the ultimate length of the sequence is not predicable, what was clear to the trader was that the previous highest uptrend sequence before the long run up was five new consecutive highs. When a previous sequence of highs or lows is broken by a new sequence, this is an alert that the sentiment is becoming stronger than ever.
After the 20 new consecutive highs were achieved, GBP/USD no longer had the energy to repeat this sequence. It entered into a series of smaller consecutive new daily highs, and reversals into consecutive new lows. GBP/USD ended with a reversal up with two consecutive new daily highs.
Price break charts can be used for any time frame. Scalpers could use a one-minute price break to spot what is the intra-hour prevailing sentiment. While price break charts do not predict the duration, or the distance of a new trend, they reveal the strength of the prevailing sentiment. That can be enough to get an edge for the scalper or the long-term trader.
The long arm of Dodd-Frank
The U.S. Securities and Exchange Commission plans to vote today on a plan that will define how far its regulations reach into a segment of the $710 trillion global swaps market.
Transactions executed by foreign divisions of banks including JPMorgan Chase & Co. and Goldman Sachs Group Inc. will be subject to U.S. rules if the affiliate’s trades are legally guaranteed by the parent company, the SEC said in a statement. The new rule comes as Wall Street takes steps to restructure trades overseas to avoid Dodd-Frank Act regulations intended to increase competition and price transparency.
U.S. regulators have faced a backlash from European and Asian authorities for overreaching in their desire to apply Dodd-Frank rules overseas. Meanwhile, Wall Street lobbying organizations have sued the Commodity Futures Trading Commission, which is the primary U.S. regulator of derivatives, to limit the international scope of the agency’s power.
“The SEC has no excuse not to strongly regulate Wall Street’s overseas derivatives gambling,” Dennis M. Kelleher, president of Better Markets, a Washington-based nonprofit that advocates stricter bank regulation, said in an e-mail.
Cross-border application of U.S. derivatives rules is one of the most contentious features of Dodd-Frank, the regulatory expansion enacted after the 2008 credit crisis. The law gave the SEC authority over trading in equity and some credit-default swaps, about 5 percent of U.S. swaps, while the CFTC oversees the rest: swaps on interest rates, currencies, and credit indexes.
Split market
David Felsenthal, a New York-based partner at the Clifford Chance law firm, said the split oversight could cause problems for credit-default swaps.
“It will be very difficult if there is any inconsistency to try to mesh the two markets together,” Felsenthal said in a phone interview.
The SEC last year proposed to exempt U.S. banks’ overseas affiliates from registration when they deal predominantly with foreign clients. The agency changed that approach in the final rule, saying overseas trades guaranteed by the U.S. parent will be regulated when the guarantee is “a legally enforceable right.”
Critics of the SEC’s approach faulted the agency last year for taking a different approach than the CFTC, which oversees about 95 percent of the U.S. swaps market. Others said the SEC’s strategy would allow banks to escape regulation by moving more swaps deals offshore, which would raise the risk that an affiliate’s collapse could harm the U.S. parent company.
Guaranteed affiliates
The SEC’s final rule should cover any trading by an affiliate whose trades are guaranteed by its U.S. owners, whether legally or implicitly, said Better Markets’ Kelleher.
“They have seen how Wall Street has evaded the CFTC’s rules since last July,” Kelleher said. “We have spent hours with the SEC staff discussing this and a straightforward solution: Directly prohibit de facto guarantees, Wall Street’s latest tactic to avoid sensible and necessary rules.”
The Federal Deposit Insurance Corp., which regulates Wall Street banks, has said it is monitoring the move by banks to remove parent guarantees from affiliates or specific transactions so they can trade in the interdealer market free of many Dodd-Frank restrictions. The CFTC is reviewing the overseas changes and analyzing whether there is “evasive activity under way,” Commissioner Mark P. Wetjen said on May 14.
Market fracturing
Under CFTC guidelines, overseas affiliates that lack a parent guarantee fall under fewer restrictions than do foreign branches or guaranteed affiliates of U.S. banks. As a result, the swaps market is fracturing with trades in the U.S. falling under Dodd-Frank and trades elsewhere subject to local laws.
Trades with non-U.S. participants are occurring off of the new Dodd-Frank swap-execution facilities because they are being done by the non-guaranteed subsidiaries, John Nixon, an executive at London-based ICAP Plc, the world’s largest interdealer broker, said at a CFTC advisory meeting on May 21.
The U.S. House voted 265-144 to approve legislation yesterday that would restrict the CFTC’s ability to impose rules overseas, among other changes to the agency’s authority over agriculture, energy and financial markets.
U.S. Economic Mash-Up: Mortgage Applications Fall, Durable Goods Orders and Services
U.S. home mortgage applications declined last week, with both applications for purchase and refinancing declining, according to the Mortgage Bankers Association.
MBA’s seasonally-adjusted gauge of mortgage application trends, which incorporates refinancing and house purchases, declined 1 percent in the week through June 20. The index of refinancing applications plunged 0.9 percent while that for home purchases declined 1.2 percent.
The rates for fixed 30-year mortgage averaged 4.33 percent last week, much lower than 4.36 percent recorded the previous week. The survey reviews at least 75 percent of U.S. retail home mortgage filings.
Separate data showed that orders for durable manufactured items in the U.S. unexpectedly plunged in May, indicating that the economy may not grow as fast as expected, despite another set of data showing businesses plan to spend more on capital investment.
Orders for long-lasting goods fell 1.0 percent after demand for machinery, transportation, computers and other electronic products, defense capital items, electrical appliances, equipments and components tumbled.
Overall orders for durable goods had accelerated by 0.8 percent in April due to more orders for defense equipment.
Non-defense capital item orders adjusted for aircraft, which signals how businesses intend to spend their money on capital goods, rose 0.7 percent. This compares with a decline of 1.1 percent posted in April.
Another report showed that U.S. services sector grew by the quickest pace in over 4 ½ years, as business activity increased.
Markit Economics reported that its preliminary Purchasing Managers Index rose to 61.2 this June, the most since October 2009, up from 58.1 in May. A figure above 50 shows growth in economic activity.EUR/USD Technical Analysis – Trying to Renew Recovery
The Euro is attempting to extend is recovery against the US Dollar but a defined bullish breakout remains elusive. Prices are testing falling trend line resistance at 1.3632, with a daily close above that exposing the 1.3676-89 area marked by the June 6 high and the 38.2% Fibonacci retracement. Resistance-turned-support is at 1.3585, the May 29 low. A reversal back below that opens the door for a test of the 1.3476-1.3502 zone bracketed by the February 3 and June 5 bottoms.
The Signal And The Noise
U.S. Federal Reserve Chairwoman Janet Yellen's press conference last week came just hours after Consumer Price Index data revealed inflation of 2.1 percent year over year. Nevertheless, she was exceptionally dovish and sanguine on inflation. Yellen contended that even though the U.S. economy is near the Fed's objectives of full employment and price stability, recent data on inflation was "noise" and there continues to be considerable underutilization in the labor market. This was only the most recent demonstration of a willingness among Fed policymakers to highlight any number of economic data points to support accommodative monetary policy. It came even though labor conditions are improving toward a level associated with the non-accelerating inflation rate of unemployment (NAIRU); a tipping point of around 5.5 percent unemployment which has historically corresponded with a period of Fed tightening.
I am increasingly of the view that the Fed and investors are complacent about inflation. While a broad-based secular increase in inflation is most likely a problem for the next decade, there are a number of technical and cyclical forces working to push consumer prices higher. One technical factor is the one-time 2 percent Medicare payment cut which went into effect in 2013 and temporarily depressed healthcare costs for Medicare recipients. The recent increase in healthcare costs results largely from the year-over-year effects of this one-time cost reduction expiring.
Another inflation factor at work is shelter. With rental vacancy rates hovering near 13-year lows and new home sales soaring by 18.6 percent to an annualized pace of 504,000 units in May, we can expect a continued rise in shelter costs for the rest of the year and possibly into early 2015. As a result of these technical issues and the cyclical factors associated with the economic expansion and employment growth gathering pace, we are likely to see inflationary pressures continuing to build. It is clear that we have now passed the days of low inflation growth.
We are in the late stages of a bull market and, as I have noted before, bull markets do not die of old age, but typically end as a result of a policy misstep. If Fed policymakers want to avoid such a mistake, they might start listening more closely to the "noise."
U.S. Shelter Inflation Likely Heading HigherMay's Consumer Price Index (CPI) data surprised to the upside, with transportation and medical costs adding to the 0.3 percent month-over-month gain in core CPI. However, the biggest contributor to increasing consumer prices continues to be shelter costs, which account for over 40 percent of core CPI (and 22 percent of core Personal Consumer Expenditures (PCE), the Federal Reserve's favored gauge of inflation). Shelter inflation measured by CPI is already up 2.9 percent from a year ago, and due to falling vacancy rates and gains in home prices, shelter costs could accelerate to nearly 4 percent growth over the next year, which would push core CPI well above 2 percent.
ACTUAL CPI SHELTER YEAR-OVER-YEAR PERCENT CHANGE VS. MODEL SUGGESTED SHELTER INFLATIONThis is some advice made by Nicholas Pardini in November last year.
Nicholas Pardini is the founder and managing partner of investment firm Nomadic Capital Partners, which specializes in investing in emerging and frontier markets around the globe. His book, “The Definitive Guide to Emerging Market Currencies,” was written in response to his inability to find research on the subject.
-------
7 best currencies for long term investors
Want to buy and hold? Here's one expert's view.Foreign exchange markets tend to be the domain for short-term technical and momentum based speculators. However, with central banks around the world holding real interest rates negative and printing large quantities of money, investors’ home currencies in developed nations such as the United States, Europe and Japan may not be a safe store of value.
Stretched valuations across bond and equity markets make this an apt time to take profits, but what currencies should investors hold their cash? Here’s my top seven strongest currencies based on long-term economic fundamentals.
7) Korean won
South Korea has become a manufacturing powerhouse. The quality of Korean goods such as Samsung Electronics, Hyundai and Posco meets and often exceeds Japanese competitors. In spite of a weak yen, South Korea maintains competitive advantage versus Japan. South Korea’s fiscal health is also strong with a 35% debt to GDP, 3.3% GDP growth, and 3.8% current account surplus.
6) Malaysian ringgit
Malaysia is the only developed nation since its independence in 1957 that has not defaulted or experienced a full year of inflation above 20%. The Malaysian central bank has an excellent track record of keeping inflation low and exports of crude oil, palm oil, minerals, and other natural resources keep foreign reserves well stocked. The tricky part for Western investors is that the ringgit can only be traded via non-deliverable forwards due to capital controls left over from the 1997 Asian financial crisis.
5) Norwegian krone
Norway has the most stable currency in Europe. With oil exports, a high standard of living, a 13% current account surplus, and a debt to GDP of just 28%, Norway is in excellent shape to maintain currency strength and hold off the structural problems of the rest of the continent. Because Norway is not part of the EU, it can serve as a financial safe haven for investors if the European debt crisis deteriorates further.
4) Chinese renminbi
China is transitioning from an export based economy to one that relies on more domestic consumption. Part of this transition will be RMB appreciation as higher domestic purchasing power of imported goods such as food and energy will be needed to increase the wealth of middle income Chinese and get them to spend money on local consumer goods and services. China has stockpiles of foreign reserves and trade surpluses which will also hold up the renminbi as the government has been intervening less to keep the currency down. The renminbi would be rated higher if it was not for strict capital controls.
3) Hong Kong dollar
The Hong Kong dollar is like the call option of currencies. It is pegged to a narrow band to the U.S. dollar, so downside risk is limited. However, if trade pressures and a weak dollar break the peg, that the Hong Kong dollar has appreciation potential of greater than 20% to match the recent gains of the renminbi against the U.S. dollar.
2) Singapore dollar
With increased disclosure in Switzerland, Singapore has become the new global center of hidden money and a favored tax haven. As income inequality increases along with the increased rates and enforcement of taxation, foreign capital inflows will continue to increase in Singapore that puts upward pressure on the currency. Singapore also has an 18%.6 current account surplus and has been the greatest beneficiary of the growth of Asian economies and Asian tourism. As seen in the chart, the Singapore dollar has one of the most stable paths of appreciation against the U.S. dollar of any currency.
1) New Zealand dollar
The New Zealand dollar is the safest store of value among the bunch. The Reserve Bank of New Zealand is the only developed nation central bank that plans on raising interest rates in the near future and the country has reformed its tax code to lower rates and increase transparency. New Zealand also has stable exports from undervalued agriculture assets.
Forum on trading, automated trading systems and testing trading strategies
Something Interesting to Read June 2014
newdigital, 2014.06.26 08:57
The Definitive Guide to Emerging Market Currencies: How to Get Started Making Money Through Trading the World's Most Dynamic FOREX Marketsby Nicholas Pardini
With central banks around the world devaluing major currencies such as the US dollar, Japanese Yen, and the euro, opportunities for higher returns are available through investing in emerging market currencies. Investing in exotic currencies such as the Chinese renminbi or Brazilian real may seem complicated, but with the help of this book we make it more accessible to investors of all sizes. The Definitive Guide to Emerging Market Currencies covers the macroeconomic underpinnings foreign currency markets, the fundamental factors that define the future strengthening of currencies in emerging markets, and how to trade these currencies. The book also goes into detail on the economic fundamentals of every significantly liquid emerging market currency along with an investing outlook for each one. For those looking to make money trading emerging market FOREX, or are just curious about emerging market currencies, this book is the best place to start. Even stock market investors benefit from learning about these FOREX markets because currency fluctuations have a huge impact on investors' total returns in any foreign country.
EUR/USD To Be Halted By 1.37
'It [GDP data] was very disappointing, and in the current situation we have very low vol, heading into month-end, and half-year end as well. So, the ducks are all lined up [for] U.S. dollar weakness.' - RBC Capital Markets (based on Reuters)
Pair's Outlook
The Euro is slowly but surely moving in the direction of the 55 and 200-day SMA on the back of a weaker greenback. This resistance at 1.37 is expected to prevent further appreciation of the single currency and thus a test of the monthly PP and 100-day SMA. Even if this is not the case, and the currency pair continues to advance, the long-term outlook will remain bearish as long as the major down-trend line at 1.39 stays intact.
Traders' Sentiment
While the sentiment of the market is lightly bearish towards EUR/USD (56% of open positions are short), the number of buy orders is increasing. Their share 50 pips from the spot price soared from 39% up to 60% compared to the most recent update.
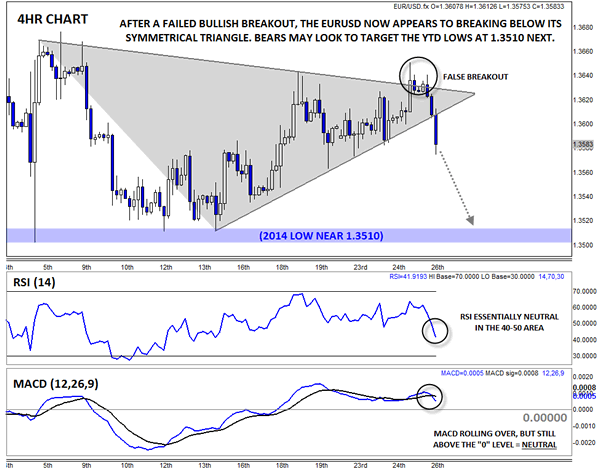
EURUSD: US and Germany Square Off in World Cup and FX Market
The US and Germany kick off a "massive" World Cup match in just a few hours, but the currencies of the two countries have also been locked in a tight competition this week. Yesterday, it appeared the Germans (and the rest of the Eurozone) were pulling ahead with an attempted breakout from the EURUSD's 3-week symmetrical triangle pattern (see 4hr chart below). However, the US stepped up its game at the last second and drove the pair back down to the bottom of its triangle near 1.3600. As we go to press, the pair is inching below the lower trend line, but given the failed upside breakout yesterday, it would be prudent to wait for a daily close below this level before confirming the breakdown.
For the uninitiated, a breakout from a symmetrical triangle pattern suggests a strong move in the same direction. Using the measured move method of projecting a target based on the "height" of the triangle points to a possible 150-pip move once the breakout is confirmed, which could drive the EURUSD either back up toward 1.3800 or down to new 2014 lows in the mid 1.3400s, so there could be plenty at stake here for traders.
Unfortunately, the secondary indicators are not giving any advance warning of which way the pair may trend next. The RSI is essentially neutral near the 50 level, while the MACD is rolling over, but still holding above the 0 level, showing receding bullish momentum.
Coincidentally, the resolution of the German-US battle in the FX market may take place at the same time as the countries' World Cup clash. Oddsmakers favor the Germans on the futbol pitch, but the Americans currently have the upper hand on traders' screens. No matter how these situations resolve, fans and traders are in for some serious excitement over the course of the day!
2014-06-26 22:45 GMT (or 00:45 MQ MT5 time) | [NZD - Trade Balance]
if actual > forecast = good for currency (for NZD in our case)
[NZD - Trade Balance] = Difference in value between imported and exported goods during the reported month. Export demand and currency demand are directly linked because foreigners must buy the domestic currency to pay for the nation's exports. Export demand also impacts production and prices at domestic manufacturers.
Also Called : Overseas Merchandise Trade.
==========
New Zealand Trade Surplus NZ$285 Million
New Zealand posted a merchandise trade surplus of 285 million New Zealand dollars in May, Statistics New Zealand said on Friday - representing 6.2 percent of exports.
That topped forecasts for an increase of NZ$250 million following the NZ$534 million surplus in April.
Exports climbed NZ$528 million or 13.0 percent on year to NZ$4.60 billion - beating expectations for NZ$4.50 billion, which would have been unchanged from the previous month.
"Goods exports are high this month compared with May 2013," international statistics manager Jason Attewell said. "However, it appears the growth in exports seen in the past year has leveled off."
Exports to China, New Zealand's main export partner, were up NZ$204 million to NZ$868 million in May. This was led by milk powder, crude oil, and sheep meat. This is the first shipment of crude oil to China since July 2009.
The continued growth of exports to China has resulted in the two-way trade of goods (exports plus imports) reaching NZ$20.1 billion for the first time in the year ended May 2014. This was up NZ$4.7 billion from the previous year, with exports contributing NZ$4.0 billion to this increase.
Exports to Australia fell NZ$81 million to NZ$667 million.
Imports added NZ$283 million or 7.0 percent on year to NZ$4.32 billion versus forecasts for NZ$4.23 billion and up from NZ$3.96 billion a month earlier.
Capital goods led the rise, up NZ$186 million. This was led by trucks, cranes, and excavators.
Vehicles, parts, and accessories also fueled the increase in imports, up NZ$114 million.
Seasonally adjusted, exports added 0.5 percent on month in May, while imports jumped 2.9 percent.
Year to date, New Zealand's trade surplus was NZ$1.373 billion - topping expectations for NZ$1.350 billion and up from NZ$1.191 billion a month earlier.
EUR/USD getting closer weekly high of 1.3650
FXStreet Chief Analyst Valeria Bednarik comments on the EUR/USD moves following the release of better than expected German CPI numbers on Friday, saying that the pair is approaching its weekly high of 1.3650.
Key quotes
"Stocks up in the US and some relaxed confidence ahead of next week events with the EUR/USD hourly chart showing indicators bouncing higher from their midlines and price advancing above a mild bullish 20 SMA."
"In the 4 hours chart however, the neutral stance prevails with 200 EMA flat around 1.3645 acting as immediate short term resistance."