Press review - page 285
You are missing trading opportunities:
- Free trading apps
- Over 8,000 signals for copying
- Economic news for exploring financial markets
Registration
Log in
You agree to website policy and terms of use
If you do not have an account, please register
His Secret To Day Trading Gold (based on thetechnicaltraders article)
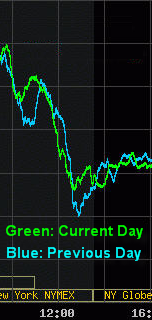
"The chart below shows the last 4 intraday sessions for gold using the GLD ETF. As you can see these sessions had very similar price movement. This is a 5 minute chart of gold using GLD. I trade it using the 3 minute chart as it allows the best timing for entering and exiting positions and this 5 minute chart keeps my head clear for the key turning points because it is easy to get caught up in the one minute chart noise and miss the important patterns."

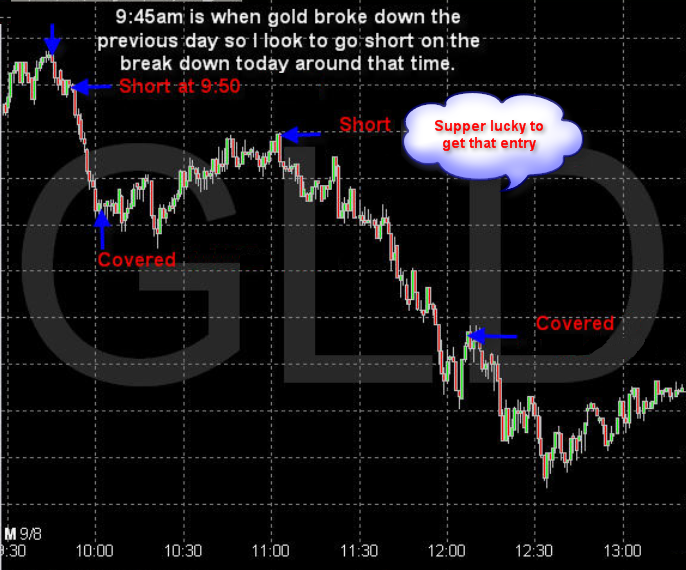
"Above is the chart of GLD ETF and some actual trades. I am a very conservative trader and I like to lock in profits once I am satisfied with a move or if the chart shows any indication it may go against my position. I tend to exit trades a little too early but my focus is on catching the middle section of a trend because they are the safest areas to trade I think. When there are no swing trading setups I focus on finding these intraday day trading gold patterns along with SP500 index and Nasdaq day trades to generate my weekly income."
if actual > forecast (or previous data) = good for currency (for USD in our case)
[USD - Dallas Fed Manufacturing Activity] =The Dallas Fed conducts the Texas Manufacturing Outlook Survey monthly to obtain a timely assessment of the state's factory activity. Firms are asked by Federal Reserve Bank of Dallas whether output, employment, orders, prices and other indicators increased, decreased or remained unchanged over the previous month. Survey responses are used to calculate an index for each indicator. Each index is calculated by subtracting the percentage of respondents reporting a decrease from the percentage reporting an increase.
==========United States Dallas Fed Manufacturing Business Index fell from previous -4.4 to -11.2 in February
AUDIO - Chris Vermeulen – Gold Still in a Bear Market, but Don’t Lose Hope
Gold is still in a bear market, like it has been for the past three years. There’s an opportunity to pick up a quick profit when it rebounds from its current plunge, but don’t be fooled. It’s all setting up very nicely for the ultimate bull market that’s getting closer. Same with the much maligned Toronto Venture Exchange (TSX:V), which is at record lows due to its composition of miners and resource companies.
Weaker-than-expected U.S. housing data lifted gold prices from a seven-week low on Monday, but charts suggest that investors shouldn't get too excited.
Gold got some reprieve on Monday, rebounding from a seven-week low intraday after data showed U.S. home resales for January declined to a nine-month low. The data are unlikely to dent the overall trend, however; gold posted its fourth consecutive weekly decline last week amid a stronger U.S. dollar and expectations that the Federal Reserve will raise interest rates later this year.
Meanwhile, the outlook on charts is bearish.
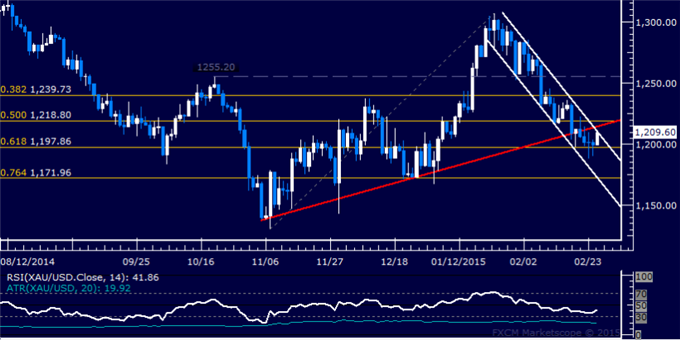
The weekly gold chart has developed a complex technical pattern with three features: a downtrend line; strong historical support; certain pattern behavior in the Guppy Multiple Moving Average (GMMA) indicator.
Prices challenging pivotal support at 1197.86, the 61.8% Fibonacci retracement. A break below this barrier exposes channel floor support at 1176.34, followed by the 76.4% level at 1171.96. Alternatively, a reversal above 50% Fib at 1218.80 targets the 38.2% retracement at 1239.73.
if actual > forecast (or previous data) = good for currency (for USD in our case)
[USD - Consumer Confidence] = Level of a composite index based on surveyed households. Financial confidence is a leading indicator of consumer spending, which accounts for a majority of overall economic activity.
==========U.S. Consumer Confidence Index Pulls Back More Than Expected In February
After reporting a sharp increase in U.S. consumer confidence in the previous month, the Conference Board released a report on Tuesday showing that its consumer confidence index pulled back by more than expected in the month of February.
The Conference Board said its consumer confidence index tumbled to 96.4 in February from an upwardly revised 103.8 in January.
Economists had expected the index to drop to a reading of 99.1 from the 102.9 originally reported for the previous month.
The Justice Department Goes Hunting For A Gold Price Fix (based on forbes article)
Quaint or corrupt, that’s the question the U.S. Justice Department and the Commodity Futures Trading Commission have set themselves in their attempt to prize back the lid on the centuries-old world of trading metals in London.
Gold is the primary focus of the double-barreled inquiry with silver, platinum and palladium also on the agenda.
What the U.S. investigators hope to find is a smoking gun linking some of the world’s biggest banks to allegations of market rigging, a job which European investigators have already dropped.
The starting point for the metals probe, which was launched before Christmas but has only just been revealed, is the process by which benchmark metal prices have historically been set in the private world of London banking.
Deep-Seated Flaws In Benchmark Setting
Similar inquiries into interest-rate setting and foreign exchange dealing has already revealed deep-seated flaws, some of which can be traced to old methods of price-setting not tolerated in a modern world of high-speed financial transactions.
In a way what’s happening in the metals market is a case of the old world of lax London methods, where a man’s word was considered his bond, bumping into the new world of tight U.S. regulations where business is done by the book.
European regulators, it seems, were prepared to accept that London’s way of trading metals was understandable when looked at from an historic perspective which took into account the fact that systems simply evolved, no-one designed them.
Fixing The Fix
The solution was the unfortunately-named London Gold Fix, a benchmark price first struck in September 1919 after representatives of five London-based banks swapped market information by telephone, a system which later became a twice-daily meeting to set a morning and afternoon gold price.
There have been frequent changes to the way the gold price is fixed with most gold exchanged these day by electronic means on markets open 24-hours a day.
Other metals have also been traded in what now look to be archaic systems, including the way members of the London Metal Exchange (LME) trade certain metals in five-minute bursts of open outcry bidding while sitting in a ring at the exchange located in London’s business heart, The City.
Mining companies, and metal buyers, had no way of knowing whether the prices quoted were correct but one Australian mining company became suspicious when it consistently failed to get the price quoted for the cobalt it produced as a by-product at its nickel mines.
Trading the News: German Unemployment Change (based on dailyfx article)
Another 10K contraction in German Unemployment may encourage a near-term rebound in EUR/USD as it raises the prospects for a stronger recovery in the euro-area.
What’s Expected:
Why Is This Event Important:
A further improvement in Europe’s largest economy may limit the European Central Bank’s (ECB) scope to further embark on its easing cycle and heighten the appeal of the single currency especially as the member-states take unprecedented steps to mitigate the risk for contagion.
However, waning business confidence paired with the slowdown in production may drag on employment, and a dismal labor report may heighten the bearish sentiment surrounding the Euro as ECB President Mario Draghi keeps the door open to further support the monetary union.
How To Trade This Event Risk
Bullish EUR Trade: Unemployment Contracts 10K or Greater
- Need green, five-minute candle following the print to consider a long EUR/USD trade
- If market reaction favors buying Euro, long EUR/USD with two separate position
- Set stop at the near-by swing low/reasonable distance from entry; look for at least 1:1 risk-to-reward
- Move stop to entry on remaining position once initial target is hit, set reasonable limit
Bearish EUR Trade: German Labor Report Disappoints- Need red, five-minute candle to favor a short EUR/USD trade
- Implement same setup as the bullish Euro trade, just in opposite direction
Potential Price Targets For The ReleaseEUR/USD Daily Chart
- Long-term outlook remains bearish as the RSI retains
the downward trend from 2013, but need a break/close below support to
revert back to the approach to ‘sell bounces’ in EUR/USD.
- Interim Resistance: 1.1440 (23.6% retracement) to 1.1480 (78.6% expansion)
- Interim Support: 1.1300 (161.8% expansion) to 1.1310 (100% expansion)
Impact that the GermanyUnemployment Change has had on EUR during the last release(1 Hour post event )
(End of Day post event)
The number of unemployed in Germany contracted 9.0K in January, while the jobless rate narrowed to a record-low of 6.5% from a revised 6.6% the month prior. Despite the ongoing improvement in Europe’s largest economy, the European Central Bank’s (ECB) may continue to highlight a dovish tone for monetary policy as it struggles to achieve its one and only mandate to deliver price stability. Nevertheless, EUR/USD tracked higher following the report, with the pair pushing above the 1.1300 handle to end the day at 1.1326.
AUDIO - Oil, Money & Dividends with Mike McMahon (based on fxstreet article)
Mike and Merlin start things off by analyzing the Aussie Dollar and potential trade opportunities going forward. Focus then shifts to one of the larger Forex brokers stock as a listener is holding thousands of shares! Finally, Mike talks about how to capitalize on the current oil price by looking for strong dividend plays.

Gold Tries to Launch Recovery, SPX 500 Resumes Upward Push (based on dailyfx article)
GOLD TECHNICAL ANALYSIS
Prices are attempting to launch a recovery from support at 1197.86, the 61.8% Fibonacci retracement. The reversal requires a push above a major resistance cluster in the 1209.67-18.80 area, marked by a falling channel top, the underside of a recently broken trend line and the 50% Fibonacci retracement. If a break does materialize, the next upside barrier comes in at 1239.73, the 38.2% level. Alternatively, a turn below 1197.86 aims for the intersection of channel floor support and the 76.4% Fib at 1171.96.