if actual > forecast (or actual data) = good for currency (for USD in our case)
[EUR - French Manufacturing PMI] = Level of a diffusion index based on surveyed purchasing managers in the manufacturing industry. It's a leading indicator of economic health - businesses react quickly
to market conditions, and their purchasing managers hold perhaps the
most current and relevant insight into the company's view of the economy.
Trading the News: New Zealand Trade Balance(adapted from dailyfx article)
New Zealand Trade Deficit of NZD1.125B Would Mark Largest Shortfall Since August 2013
Exports to Slow to NZD 3.20B- Lowest Since September 2010
A marked expansion in New Zealand’s trade deficit may spark fresh
monthly lows in the NZD/USD as it dampens the outlook for growth and
inflation.
What’s Expected (MQ Metatrader 5 time as GMT+2):
Why Is This Event Important:
The weakening outlook for global trade may drag on interest rate
expectations as the Reserve Bank of New Zealand (RBNZ) adopts a neutral
tone for monetary policy, and Governor Graeme Wheeler may keep the cash
rate on hold throughout the remainder of the year in an effort to combat
the downside risk surrounding the real economy.
The trade report may highlight a weakening outlook for growth as
business confidence deteriorates, and a marked expansion in the trade
deficit may keep the RBNZ on the sidelines as the central bank continues
to weigh the impact of the rate hikes from earlier this year.
However, the improved terms of trade along withexpectations for a faster
recovery may generate a better-than-expected print, and we may see
central bank Governor Wheeler show a greater willingness to further
normalize monetary policy should the data dampen the downside risks
surrounding the New Zealand economy.
How To Trade This Event Risk
Bearish NZD Trade: Deficit Widens to NZD1.125B or Greater
Need red, five-minute candle following the release to consider a short NZD/USD trade
If market reaction favors a long dollar trade, short NZD/USD with two separate position
Place stop at the near-by swing high/reasonable distance from entry; look for at least 1:1 risk-to-reward
Move stop to entry on remaining position once initial target is hit, set reasonable limit
Need green, five-minute candle to favor a long NZD/USD trade
Implement same setup as the bullish dollar trade, just in opposite direction
Potential Price Targets For The Release NZD/USD Daily
May see the bearish trend continue to take shape should RSI dip back into oversold territory
Interim Resistance: 0.8370 (38.2% expansion) to 0.8390 (38.2% retracement)
Interim Support: 0.7970 (50.0% retracement) to 0.8000 pivot
Impact that New Zealand Trade Balance has had on NZD/USD during the last release
Period
Data Released
Estimate
Actual
Pips Change
(1 Hour post event )
Pips Change
(End of Day post event)
July 2014
08/25/2014 22:45 GMT
-475M
-692M
-10
+14
New Zealand’s trade balance showed a $692 million deficit in July after
posting a $242 million surplus the month prior, with the region marking
the first trade deficit in 11 months on the back of falling prices for
dairy and forest product exports. The weakening outlook for global trade
may continue to dampen the appeal of the New Zealand dollar as it
limits the Reserve Bank of New Zealand’s (RBNZ) scope to normalize
monetary policy at a more aggressive pace. Nevertheless, the impact of
the disappointing print was limited and short-lived as the New Zealand
dollar regained its strength following the Asian trade, with the NZDUSD
closing the day at 0.8340.
New Zealand posted a merchandise trade deficit of NZ$472 million in
August, Statistics New Zealand said on Wednesday - representing 13
percent of exports.
That beat forecasts for a deficit of NZ$1.125
billion following the downwardly revised NZ$724 billion shortfall in
July (originally NZ$692 million).
Exports were worth NZ$3.52 billion, topping expectations for NZ$3.20 billion and down from NZ$3.69 billion.
Live
animals led the rise in exports, due to live cattle. Milk powder,
butter, and cheese exports also contributed to the increase, led by
higher quantities. The 16-percent rise in milk powder, butter, and
cheese was led by milk fat and cheese.
"Cattle, milk fat, and
cheese contributed to the rise in exports," international statistics
manager Jason Attewell said. "It is the first time in three years that a
rise in dairy was not led by milk powder."
Technical Analysis: EURUSD Breakout(based on dailyfx article)
EURUSD Breaks Resistance
Breakout Signaled Above 1.2874
Bearish Reversal Signaled Under 1.2860
As price with any breakout, there is always the potential for a price reversal. In the event of a false breakout, traders would first look for price to move back into range resistance located at the R3 pivot at a price of 1.2860. Once price has moved back into the trading range, reversal traders can look for price to potentially traverse the current 29 pip range back to support found at 1.2831. It should also be noted that price has the potential to break towards a lower low in the direction of the daily trend below the S4 pivot at 1.2818. In either scenario, this would indicate an end of bullish momentum drawing a conclusion to the present breakout environment.
Silver Breakdown Hints at USD Turning Point; EUR/USD, USD/CAD Not Done(based on dailyfx article)
Silver/XAGUSD fall through support signals turning point.
EURUSD may push lower again.
During August and early-September, the rise of US Treasury yields neatly
coincided with an already-bullish landscape for the US Dollar, proving
to be further fuel to the fire. Yet over the past two weeks, the
greenback has persisted as a top performer while long-end US yields have
come back in after their brief jump. See the brief video above for what the technical breakdown in Silver
means for the majors such as EURUSD and USDCAD over the coming days.
Reflecting volatility in commercial aircraft orders, the Commerce
Department released a report on Thursday showing a sharp pullback in
orders for manufactured durable goods in August following the
substantial increase seen in July.
The report said durable goods
orders tumbled by 18.2 percent in August after surging up by 22.5
percent in July. Economists had been expecting orders to plunge by about
18.0 percent.
Excluding orders for transportation equipment,
durable goods orders actually rose by 0.7 percent in August compared to a
0.5 percent drop in July. The rebound matched economist estimates.
The euro hit a 22-month low against the dollar on Thursday on the
prospect of diverging monetary policy between the Federal Reserve and
the European Central Bank as rate differentials swing decisively in the
greenback’s favor.
The common currency fell to $1.2730 on trading platform EBS, its
lowest since November 2012, and was down 0.3 percent on the day. The
dollar index hit a new four-year high. The latest drop came as yield
differentials between US 10-year Treasuries and their German
counterparts traded near 15-year highs, driving more investors to buy
the dollar.
A recent batch of economic data has also highlighted the diverging
economic outlook for the euro zone and the United States. While German
business sentiment fell again in September to its lowest level in nearly
1-1/2 years, sales of new U.S. single-family homes surged in August to
their highest level in more than six years.
Canadian GDP, US Consumer confidence, ISM Manufacturing PMI,
Rate decision in the Eurozone and important employment figures from the
US including the all-important NFO report. These are the major events
on Forex calendar. Here is an outlook on the main market-movers ahead.
Last week, the Scottish referendum threatening to quit the UK, resulted
in a vote against independence pushing the pound higher after sharp
drops. Likewise, the US dollar gained momentum as ECB Chairman Mario
Draghi, RBA’s Stevens and Chinese policy makers considered using the
Fed’s tactics to fight downturn economic trends. Finally the US GDP
release showed the economy expanded at an annual rate of 4.6% in the
second quarter, better than the 4.2% estimate made a month ago,
providing momentum for strong growth the rest of the year. Will the US
continue its growth trend?
Eurozone Inflation data:
Tuesday, 9:00. Euro zone inflation edged up in August 0.3% after
posting 0.4% rise in the previous month. The increase was in line with
market forecast. The main price increase occurred in rents and
car-repair. The Euro area remained in the “danger zone” of below 1% for
11 straight moths. The recent rate cuts and asset purchases are
expected to stimulate the economy and boost inflation. ECB next step
may involve a more massive bond-buying program. Euro zone inflation is
expected to gain 0.3% this time.
Canadian GDP:
Tuesday, 12:30. Canadian economy expanded 0.3% on a monthly base in
June, following a 0.5% gain in May. The reading was better than the
0.2% expansion anticipated by analysts. The increase was driven by an
increase in mining and oil and gas extraction offsetting the fall in
the manufacturing sector. On a yearly base, GDP edged up 3.1% in June
the highest growth rate since September 2011. The Central Bank expects
that the economy will expand 2.2% in 2014 and 2.4% in 2015. GDP is
forecasted to increase by 0.2% in July.
US CB Consumer Confidence:
Tuesday, 14:00. US consumer confidence picked up in August, reaching
92.4 from a downwardly revised 90.3 the prior month. The reading was
higher than the 89.1 reading projected by analysts and posted the
fourth straight rise. Better business conditions and strong job growth
boosted consumer’s moral. Consumers also forecasted an inflation rise
of 5.5% in the coming 12 months. Consumer confidence is expected to
reach 92.2 this time.
US ADP Non-Farm Employment Change:
Wednesday, 12:15. ADP payroll numbers plunged in August to 204,000,
from 212,000 in the previous month. However the ADP figures have proved
to be volatile, showing only the general trend of the Non-Farm
payrolls coming later that week. Economists expected a stronger release
of 218,000. Overall, employment figures remained high, posting the
fifth straight month of job gains above 200,000. US job market is
expected to expand by 206,000 positions in September.
US ISM Manufacturing PMI: Wednesday,
14:00. U.S. manufacturing activity edged up to its highest level in
nearly 3-1/2 years in August, rising to 59, after a 57.1 release in
July, amid a strong jump of a 3.4% in consumer spending during July,
indicating a growth trend in the US economy. Economists expected a
reading of 57 points. Private construction, the largest portion of
construction spending, rose 1.4%, its highest level since November
2008. U.S. manufacturing is predicted to reach 58.6.
Eurozone rate decision:
Thursday, 11:45. The European Central Bank cut its benchmark rate to
0.05% in September from 0.15% in August. ECB President Mario Draghi
noted the rate cut reached the lower bound following a downturn trend
in the Eurozone economy with low inflation, sinking deeper below the
ECB’s target of just under 2 %. The ECB also lowered the rate on bank
overnight deposits to -0.20%. No change in rates is expected now.
US Unemployment Claims:
Thursday, 12:30. The number of people filing initial claims for
unemployment benefits increased by 12,000 last week to 293,000, after
contracting sharply two weeks ago. However despite the sharp rise, the
level of applications remains near pre-recession levels, indicating
that hiring remains strong. Over the past year, the four-week average
for applications has fallen 7.1%. The total number of people receiving
benefits ticked up by 7,000 to 2.4 million. He number of claims is
expected to rise to 299,000.
US Non-Farm Employment Change and Unemployment rate:
Friday, 12:30. The US economy added 142,000 jobs in August, the lowest
figure this year after a 212,000 rise in July. The sharp fall came as a
surprise to analysts, expecting a gain of 226,000. However, the
unemployment rate declined to 6.1% from 6.2% in the previous month, in
line with market forecast. The US had added an average of 212,000 jobs
each month over the prior 12 months. While the monthly release was
weaker than anticipated, the longer-term trend remains positive. Gains
now average 207,000 over the last three months. A gain of 216,000 jobs
is expected in the NFP report.
US Trade Balance: Friday,
12:30. The U.S. trade deficit narrowed in July to its lowest level
since January, reaching to a seasonally adjusted $40.5 billion, from
$40.8 billion in June.
Exports of automobiles, telecom equipment, industrial machines and
semiconductors increased. Imports of oil products increased, but rising
domestic production reduced the trade deficit in petroleum to its
lowest in more than five years. The decline in trade deficit reinforces
views that the US economy continues to strengthen. The U.S. trade
deficit is expected to decline further to $41.0 billion in July.
US ISM Non-Manufacturing PMI:
Friday, 14:00. The U.S. service sector continued to expand in August,
reaching 59.6 after gaining 58.7 in July, beating forecast of 57.3. The
majority of responders were optimistic regarding business conditions.
The business activity index showed a reading of 65, up from July’s
reading of 62.4; the new orders index hit 63.8, down from the previous
reading of 64.9 and the employment index rose to 57.1, from July’s
reading of 56. Overall, the ISM manufacturing and non-manufacturing
reports suggest a continued improvement in the U.S. economy. US ISM
Non-Manufacturing PMI is forecasted to reach 58.5.
The EUR/USD pair initially tried to rally during the week, but as you
can see ended up falling and slicing through the 1.28 level like it
wasn’t even there. Because of this, we believe that the euro continues
to offer selling opportunities on rallies, but at this point in time we
think that the market is probably aiming for the 1.25 handle. Be aware
though, this is a market that is certainly oversold by any stretch of
imagination and a snapback rally could happen at any point. Ultimately
though, we have no plans on buying.
The dollar rose to fresh six year highs against the yen on Friday and
hit 14-month peaks against the euro after data showed that the U.S.
economy grew at its fastest pace in two-and-a-half years in in the
second quarter.
USD/JPY hit highs of 109.52, the most since August 2008 and was last up 0.49% to 109.26.
EUR/USD was at lows of 1.2682 late Friday, the weakest since November 2012.
The US Dollar Index, which tracks the performance of the greenback
versus a basket of six other major currencies ended Friday’s session up
0.51% to a four year high of 85.77, capping its eleventh consecutive
weekly gain.
The dollar was boosted after the Commerce Department reported that U.S.
gross domestic product was revised up to 4.6% in the three months to
June from a previous estimate of 4.2%. It was the fastest rate of
expansion since the fourth quarter of 2011.
The upbeat data added to the view that the strengthening economic
recovery may prompt the Federal Reserve to raise interest rates sooner
than markets are expecting.
In contrast, the Bank of Japan and the European Central Bank look likely
to stick to a loose monetary policy stance amid concerns over faltering
economic growth.
The pound fell to more than one week lows against the stronger dollar,
with GBP/USD down 0.44% to 1.6243 late Friday. Elsewhere, sterling was
close to two year highs against the single currency, with EUR/GBP at
0.7806 in late trade.
The commodity linked dollars fell to multi-month lows against the
greenback. AUD/USD was down 0.29% to an almost six month trough of
0.8761 late Friday, while NZD/USD hit one year lows of 0.7860. USD/CAD
was up 0.44% to 1.1156, the highest level since March.
Also Friday, the Russian rouble fell to a fresh record lower against the
greenback, with USD/RUB up 1.69% to 39.14 in late trade. The rouble was
pressured lower by falling oil prices. Crude oil is one of Russia’s
largest exports.
In the week ahead, investors will be looking ahead to euro zone
inflation data and the outcome of Thursday’s ECB meeting, while Friday’s
U.S. nonfarm payrolls report will also be in focus after August’s
report fell short of expectations. Wednesday’s Japanese manufacturing
data will also be closely watched.
Monday, September 29
In the euro zone, Germany and Spain are to release
preliminary data on consumer price inflation, which accounts for the
majority of overall inflation.
The U.K. is to release a report on net lending.
The U.S. is to produce data on personal income and expenditure, as well as a private sector report on pending home sales.
Tuesday, September 30
New Zealand is to release data on building permits, in addition to a private sector report on business confidence.
Japan
is to publish reports on household spending, retail sales and average
earnings, as well as preliminary data on industrial production.
Meanwhile, China is to publish the final reading of the HSBC manufacturing index.
The
euro zone is to release preliminary data on consumer inflation and
unemployment, while Germany is to publish data on retail sales and
unemployment.
The U.K. is to report on preliminary
business investment and the current account and IS TO release final data
on GDP growth. The country is also to produce private sector data on
house price inflation.
Switzerland is to publish its KOF economic barometer.
Later Tuesday, Canada is to release its monthly GDP report along with data on raw material inflation.
The U.S. is to publish data on business activity in the Chicago region and a report on consumer confidence.
Wednesday, October 1
Japan is to publish the results of its Tankan manufacturing and services indices.
Markets in China are to remain closed for a holiday, but the country is to release official data on manufacturing activity.
Australia is to publish data on retail sales.
The U.K. is to publish data on manufacturing activity.
The
U.S. is to release the ADP report on private sector job creation, which
leads the government’s nonfarm payrolls report by two days. Late in the
day, the Institute of Supply Management is to release a report on
manufacturing activity.
Thursday, October 2
Markets in Hong Kong will be closed for a national holiday.
Australia is to release data on building approvals and the trade balance.
In the euro zone, Spain is to release a report on the change in the number of people unemployed.
The U.K. is to publish data on construction activity.
The
ECB is to announce its benchmark interest rate. The announcement is to
be followed by a press conference with President Mario Draghi.
The U.S. is to publish the weekly report on initial jobless claims, as well as data on factory orders.
Friday, October 3
Markets in China will be closed for a national holiday.
The euro zone is to release data on retail sales, while markets in German are to be closed for a holiday.
The U.K. is to publish data on service sector activity.
Both Canada and the U.S. are to report on the trade balance.
The
U.S. is to round up the week with what will be closely watched
government data on nonfarm payrolls and the unemployment rate, while the
Institute of Supply Management is to release data on manufacturing
activity.
if actual > forecast (or actual data) = good for currency (for USD in our case)
[EUR - French Manufacturing PMI] = Level of a diffusion index based on surveyed purchasing managers in the manufacturing industry. It's a leading indicator of economic health - businesses react quickly to market conditions, and their purchasing managers hold perhaps the most current and relevant insight into the company's view of the economy.
==========
French manufacturing PMI 48.8 vs. 47.0 forecast
France’s manufacturing PMI rose more-than-expected last month, preliminary data showed on Tuesday.
In a report, Markit Economics said that French manufacturing PMI rose to a seasonally adjusted 48.8, from 46.9 in the prior month.
Analysts had expected French manufacturing PMI to rise to 47.0 last month.
Trading the News: New Zealand Trade Balance (adapted from dailyfx article)
A marked expansion in New Zealand’s trade deficit may spark fresh monthly lows in the NZD/USD as it dampens the outlook for growth and inflation.
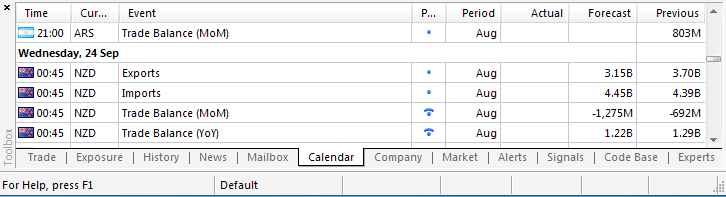
What’s Expected (MQ Metatrader 5 time as GMT+2):
Why Is This Event Important:
The weakening outlook for global trade may drag on interest rate expectations as the Reserve Bank of New Zealand (RBNZ) adopts a neutral tone for monetary policy, and Governor Graeme Wheeler may keep the cash rate on hold throughout the remainder of the year in an effort to combat the downside risk surrounding the real economy.
The trade report may highlight a weakening outlook for growth as business confidence deteriorates, and a marked expansion in the trade deficit may keep the RBNZ on the sidelines as the central bank continues to weigh the impact of the rate hikes from earlier this year.
However, the improved terms of trade along withexpectations for a faster recovery may generate a better-than-expected print, and we may see central bank Governor Wheeler show a greater willingness to further normalize monetary policy should the data dampen the downside risks surrounding the New Zealand economy.
How To Trade This Event Risk
Bearish NZD Trade: Deficit Widens to NZD1.125B or Greater
- Need red, five-minute candle following the release to consider a short NZD/USD trade
- If market reaction favors a long dollar trade, short NZD/USD with two separate position
- Place stop at the near-by swing high/reasonable distance from entry; look for at least 1:1 risk-to-reward
- Move stop to entry on remaining position once initial target is hit, set reasonable limit
Bullish NZD Trade: Trade Balance Tops Market Expectations- Need green, five-minute candle to favor a long NZD/USD trade
- Implement same setup as the bullish dollar trade, just in opposite direction
Potential Price Targets For The ReleaseNZD/USD Daily
- May see the bearish trend continue to take shape should RSI dip back into oversold territory
- Interim Resistance: 0.8370 (38.2% expansion) to 0.8390 (38.2% retracement)
- Interim Support: 0.7970 (50.0% retracement) to 0.8000 pivot
Impact that New Zealand Trade Balance has had on NZD/USD during the last release(1 Hour post event )
(End of Day post event)
New Zealand Has NZ$472 Million Trade Deficit
New Zealand posted a merchandise trade deficit of NZ$472 million in August, Statistics New Zealand said on Wednesday - representing 13 percent of exports.
That beat forecasts for a deficit of NZ$1.125 billion following the downwardly revised NZ$724 billion shortfall in July (originally NZ$692 million).
Exports were worth NZ$3.52 billion, topping expectations for NZ$3.20 billion and down from NZ$3.69 billion.
Live animals led the rise in exports, due to live cattle. Milk powder, butter, and cheese exports also contributed to the increase, led by higher quantities. The 16-percent rise in milk powder, butter, and cheese was led by milk fat and cheese.
"Cattle, milk fat, and cheese contributed to the rise in exports," international statistics manager Jason Attewell said. "It is the first time in three years that a rise in dairy was not led by milk powder."
Technical Analysis: EURUSD Breakout (based on dailyfx article)
As price with any breakout, there is always the potential for a price reversal. In the event of a false breakout, traders would first look for price to move back into range resistance located at the R3 pivot at a price of 1.2860. Once price has moved back into the trading range, reversal traders can look for price to potentially traverse the current 29 pip range back to support found at 1.2831. It should also be noted that price has the potential to break towards a lower low in the direction of the daily trend below the S4 pivot at 1.2818. In either scenario, this would indicate an end of bullish momentum drawing a conclusion to the present breakout environment.
Silver Breakdown Hints at USD Turning Point; EUR/USD, USD/CAD Not Done (based on dailyfx article)
During August and early-September, the rise of US Treasury yields neatly coincided with an already-bullish landscape for the US Dollar, proving to be further fuel to the fire. Yet over the past two weeks, the greenback has persisted as a top performer while long-end US yields have come back in after their brief jump. See the brief video above for what the technical breakdown in Silver means for the majors such as EURUSD and USDCAD over the coming days.
if actual > forecast (or actual data) = good for currency (for USD in our case)
[USD - Durable Goods Orders] = Change in the total value of new purchase orders placed with manufacturers for durable goods.
==========
U.S. Durable Goods Orders Show Sharp Pullback In August
Reflecting volatility in commercial aircraft orders, the Commerce Department released a report on Thursday showing a sharp pullback in orders for manufactured durable goods in August following the substantial increase seen in July.
The report said durable goods orders tumbled by 18.2 percent in August after surging up by 22.5 percent in July. Economists had been expecting orders to plunge by about 18.0 percent.
Excluding orders for transportation equipment, durable goods orders actually rose by 0.7 percent in August compared to a 0.5 percent drop in July. The rebound matched economist estimates.
EUR/USD Drops Below 1.27 on Divergent Outlooks
The euro hit a 22-month low against the dollar on Thursday on the prospect of diverging monetary policy between the Federal Reserve and the European Central Bank as rate differentials swing decisively in the greenback’s favor.
The common currency fell to $1.2730 on trading platform EBS, its lowest since November 2012, and was down 0.3 percent on the day. The dollar index hit a new four-year high. The latest drop came as yield differentials between US 10-year Treasuries and their German counterparts traded near 15-year highs, driving more investors to buy the dollar.
A recent batch of economic data has also highlighted the diverging economic outlook for the euro zone and the United States. While German business sentiment fell again in September to its lowest level in nearly 1-1/2 years, sales of new U.S. single-family homes surged in August to their highest level in more than six years.
Canadian GDP, US Consumer confidence, ISM Manufacturing PMI, Rate decision in the Eurozone and important employment figures from the US including the all-important NFO report. These are the major events on Forex calendar. Here is an outlook on the main market-movers ahead.
Last week, the Scottish referendum threatening to quit the UK, resulted in a vote against independence pushing the pound higher after sharp drops. Likewise, the US dollar gained momentum as ECB Chairman Mario Draghi, RBA’s Stevens and Chinese policy makers considered using the Fed’s tactics to fight downturn economic trends. Finally the US GDP release showed the economy expanded at an annual rate of 4.6% in the second quarter, better than the 4.2% estimate made a month ago, providing momentum for strong growth the rest of the year. Will the US continue its growth trend?
Exports of automobiles, telecom equipment, industrial machines and semiconductors increased. Imports of oil products increased, but rising domestic production reduced the trade deficit in petroleum to its lowest in more than five years. The decline in trade deficit reinforces views that the US economy continues to strengthen. The U.S. trade deficit is expected to decline further to $41.0 billion in July.
The EUR/USD pair initially tried to rally during the week, but as you can see ended up falling and slicing through the 1.28 level like it wasn’t even there. Because of this, we believe that the euro continues to offer selling opportunities on rallies, but at this point in time we think that the market is probably aiming for the 1.25 handle. Be aware though, this is a market that is certainly oversold by any stretch of imagination and a snapback rally could happen at any point. Ultimately though, we have no plans on buying.
The dollar rose to fresh six year highs against the yen on Friday and hit 14-month peaks against the euro after data showed that the U.S. economy grew at its fastest pace in two-and-a-half years in in the second quarter.
USD/JPY hit highs of 109.52, the most since August 2008 and was last up 0.49% to 109.26.
EUR/USD was at lows of 1.2682 late Friday, the weakest since November 2012.
The US Dollar Index, which tracks the performance of the greenback versus a basket of six other major currencies ended Friday’s session up 0.51% to a four year high of 85.77, capping its eleventh consecutive weekly gain.
The dollar was boosted after the Commerce Department reported that U.S. gross domestic product was revised up to 4.6% in the three months to June from a previous estimate of 4.2%. It was the fastest rate of expansion since the fourth quarter of 2011.
The upbeat data added to the view that the strengthening economic recovery may prompt the Federal Reserve to raise interest rates sooner than markets are expecting.
In contrast, the Bank of Japan and the European Central Bank look likely to stick to a loose monetary policy stance amid concerns over faltering economic growth.
The pound fell to more than one week lows against the stronger dollar, with GBP/USD down 0.44% to 1.6243 late Friday. Elsewhere, sterling was close to two year highs against the single currency, with EUR/GBP at 0.7806 in late trade.
The commodity linked dollars fell to multi-month lows against the greenback. AUD/USD was down 0.29% to an almost six month trough of 0.8761 late Friday, while NZD/USD hit one year lows of 0.7860. USD/CAD was up 0.44% to 1.1156, the highest level since March.
Also Friday, the Russian rouble fell to a fresh record lower against the greenback, with USD/RUB up 1.69% to 39.14 in late trade. The rouble was pressured lower by falling oil prices. Crude oil is one of Russia’s largest exports.
In the week ahead, investors will be looking ahead to euro zone inflation data and the outcome of Thursday’s ECB meeting, while Friday’s U.S. nonfarm payrolls report will also be in focus after August’s report fell short of expectations. Wednesday’s Japanese manufacturing data will also be closely watched.
Monday, September 29
- In the euro zone, Germany and Spain are to release
preliminary data on consumer price inflation, which accounts for the
majority of overall inflation.
- The U.K. is to release a report on net lending.
- The U.S. is to produce data on personal income and expenditure, as well as a private sector report on pending home sales.
Tuesday, September 30- New Zealand is to release data on building permits, in addition to a private sector report on business confidence.
- Japan
is to publish reports on household spending, retail sales and average
earnings, as well as preliminary data on industrial production.
- Meanwhile, China is to publish the final reading of the HSBC manufacturing index.
- The
euro zone is to release preliminary data on consumer inflation and
unemployment, while Germany is to publish data on retail sales and
unemployment.
- The U.K. is to report on preliminary
business investment and the current account and IS TO release final data
on GDP growth. The country is also to produce private sector data on
house price inflation.
- Switzerland is to publish its KOF economic barometer.
- Later Tuesday, Canada is to release its monthly GDP report along with data on raw material inflation.
- The U.S. is to publish data on business activity in the Chicago region and a report on consumer confidence.
Wednesday, October 1- Japan is to publish the results of its Tankan manufacturing and services indices.
- Markets in China are to remain closed for a holiday, but the country is to release official data on manufacturing activity.
- Australia is to publish data on retail sales.
- The U.K. is to publish data on manufacturing activity.
- The
U.S. is to release the ADP report on private sector job creation, which
leads the government’s nonfarm payrolls report by two days. Late in the
day, the Institute of Supply Management is to release a report on
manufacturing activity.
Thursday, October 2- Markets in Hong Kong will be closed for a national holiday.
- Australia is to release data on building approvals and the trade balance.
- In the euro zone, Spain is to release a report on the change in the number of people unemployed.
- The U.K. is to publish data on construction activity.
- The
ECB is to announce its benchmark interest rate. The announcement is to
be followed by a press conference with President Mario Draghi.
- The U.S. is to publish the weekly report on initial jobless claims, as well as data on factory orders.
Friday, October 3