Stochastic
thank you for this topic;
can you please tell about " input" for it
& the indicator in main chart.
thank you for this topic;
can you please tell about " input" for it
& the indicator in main chart.
Indicator on the main chart is Moving Average :) (standard indicator with Metatrader 5) - with levels - we call it MA Channel.
I will describe about everything on this thread: trading systems, EAs (we are having few EAs based on Stochastic uploaded on some big threads there) and so on.
Because Stochastic is one of the most popular indicator for traders and trading system developers. There is big community of Stochastic-lovers - they are uploading the images with this indicator, they are collecting some versions of this indicator (such as double stochastic, double smoothing stochastic, or [whatever] stochastic) and creating the systems based it. Besides, Stochastic indicator is most good filter for almost any manual trading system.
I will descrive later here about some trading systems, and about how to use stochastic indicator in manual trading system (with some example of the EAs for MT5).
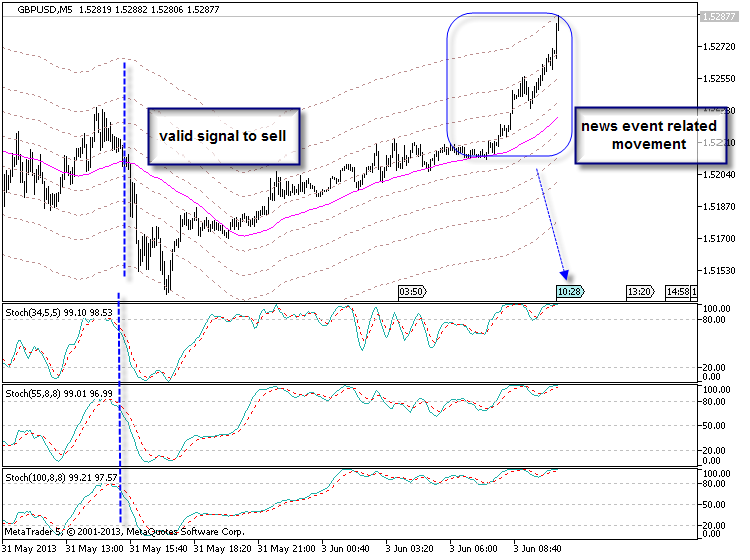
This is the real example about valid signal based on Stochastic, and some movement which is related to news event for now. We will come back to this image later but I think - it is good example about the following "news events are not our friends" :)
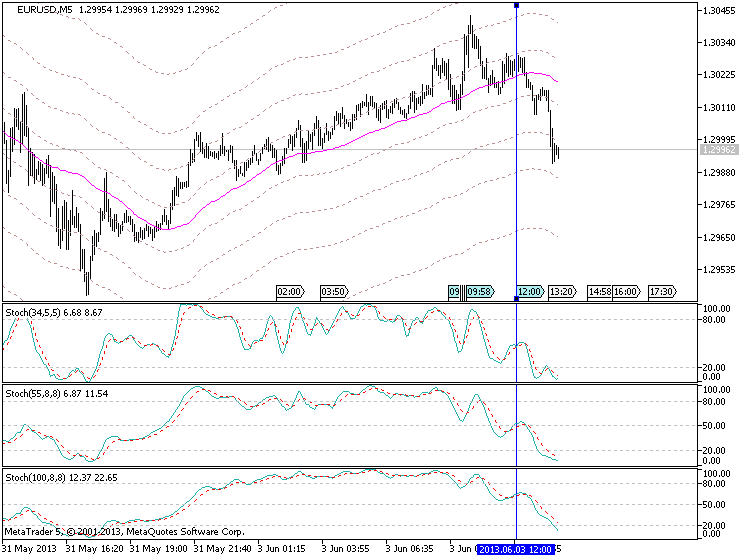
The other example with valid signal - EURUSD price was moved on unemployment rate
I will explain everything with examples and EAs, of course ... because ... it is difficult for me to turn this thread onto the theory onto the real practics ... need some time sorry
The other example with valid signal - EURUSD price was moved on unemployment rate
I will explain everything with examples and EAs, of course ... because ... it is difficult for me to turn this thread onto the theory onto the real practics ... need some time sorry
About the chart in your post. I suppose vertical blue line is signal from stochastic. Documentation speaks of 3 methods, but I don't see which method you used for this signal, maybe it's not one of the three ?
About the chart in your post. I suppose vertical blue line is signal from stochastic. Documentation speaks of 3 methods, but I don't see which method you used for this signal, maybe it's not one of the three ?
This is related to this trading system: we are openning the trade when the price is crossing MA on closed bar IF all 3 Srochastic indicators are in oversold/overbought condition started to move on our side. And MA levels 9MA channel levels) are tp and sl levels.
This is related to this trading system: we are openning the trade when the price is crossing MA on closed bar IF all 3 Srochastic indicators are in oversold/overbought condition started to move on our side. And MA levels 9MA channel levels) are tp and sl levels.
1) is that an indicator or ...?
2) about " input" for Stochastic, is there some thing can tell about them?
thank you.
1) is that an indicator or ...?
2) about " input" for Stochastic, is there some thing can tell about them?
thank you.
First of all - I need to remind about bar numbers:
How to Start with Metatrader 5
newdigital, 2013.01.11 15:31
There are some problem ...
It was many years ago when I asked one coder: "please, can you convert this good indicator onto EA".
He replied: "what?!"
I was really upset - what did I say wrong?
Well ...
Any coder understand any trading system in his programming way.
Example with this Scalp_net system (template is on this post):
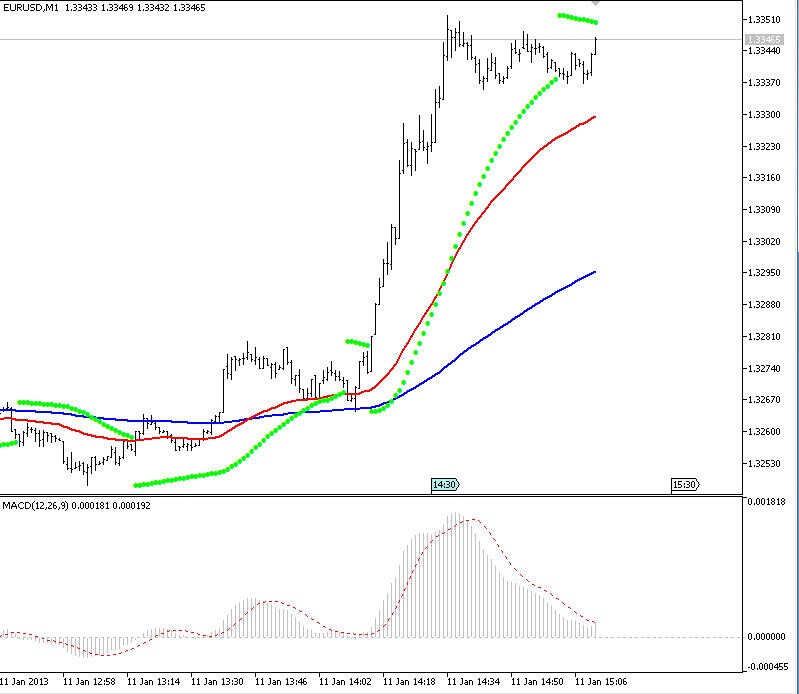
and there are bar #0, bar #1 .... bar #10 ...
What is bar #0?
It is open bar.
What is bar #1?
It is close bar (or previous bar).
example: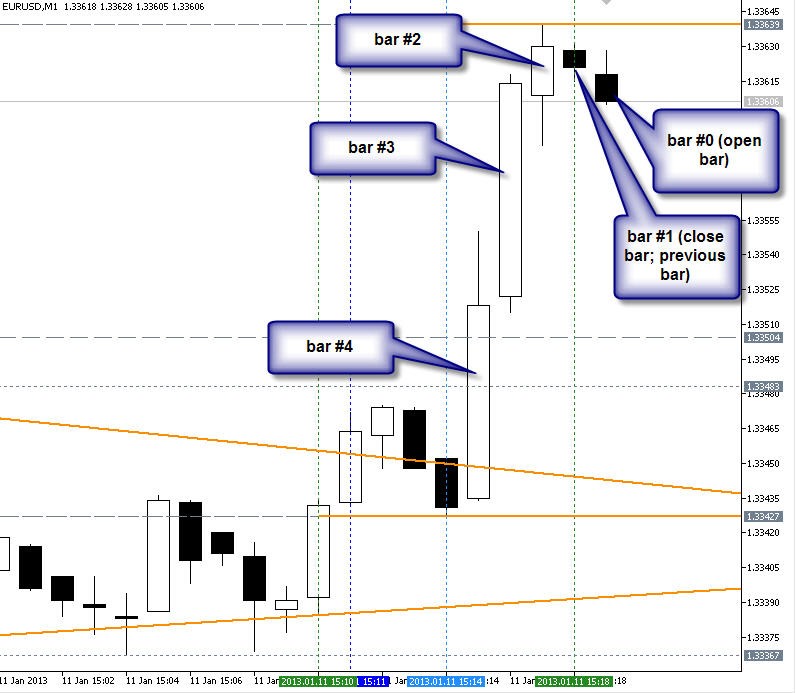
So, if you make a request to the coder: "please code EA to me when EMA with period 55 is crossing EMA with period 200 ...". Coder will say "ok, which bar numbers"
What is the crossing?
It is bar #2 of fast EMA is below bar #2 if slow EMA
AND
bar #1 of fast EMA is above or equal bar 1 of slow EMA,
right? For uptrend (buy condition)
Hi TIMisthebest:
This is Moving Average - standard indicator in Metatrader 5. You can download template from here . How to use template?
- place it (template file downloaded from this post)to templates folder (for example - to C:\Program Files\MetaTrader 5 -scalping\Profiles\Templates)
- open M5 chart of youe selected pair (in Metatrader 5)
- right mouse click on the chart - Templates - select our temnplate by name. And all the indicators will be loaded
- Free trading apps
- Over 8,000 signals for copying
- Economic news for exploring financial markets
You agree to website policy and terms of use
I decided to make some indicators' review based on trading experience and using them inside manual trading systems. So, please find the first thread about Stochastic Oscillator.
Feel free to add or write any comments concerning this indicator about how to use it inside trading systes, how to trade using this indicator and so on.
===============
Sto.chas.tic (sto kas'tik) adj. 2. Math. designating a process having an infinite progression of jointly distributed random variables.
--- Webster's New World Dictionary
===============
Stochastic is default/standard indicator in Metatrader 5 and it is located right here (look at the image):
===============
From Achelis "Technical Analysis from A to Z" :
Interpretation
The Stochastic Oscillator is displayed as two lines. The main line is called "%K." The second line, called "%D," is a moving average of %K. The %K line is usually displayed as a solid line and the %D line is usually displayed as a dotted line.
There are several ways to interpret a Stochastic Oscillator. Three popular methods include:
Buy when the Oscillator (either %K or %D) falls below a specific level (e.g., 20) and then rises above that level. Sell when the Oscillator rises above a specific level (e.g., 80) and then falls below that level.
Buy when the %K line rises above the %D line and sell when the %K line falls below the %D line.
Look for divergences. For example, where prices are making a series of new highs and the Stochastic Oscillator is failing to surpass its previous highs.===============
More detailed explanation about this indicator we can see from this small article (from MT5 documentation/help file): Stochastic Oscillator
And full description about this indicator concerning trading signals - read this very small article: Signals of the Oscillator Stochastic