stochastic formation
stochastic formation details tell me
It's not clear what exactly you want. So I believe it will not be possible to help you with more "details"...
Forum on trading, automated trading systems and testing trading strategies
Something Interesting in Financial Video January 2014
newdigital, 2014.01.08 10:55
32. How to trade Stochastics divergence in Forex
Forum on trading, automated trading systems and testing trading strategies
Something Interesting in Financial Video January 2014
newdigital, 2014.01.22 13:02
Forex Stochastics
Forum on trading, automated trading systems and testing trading strategies
newdigital, 2013.07.18 16:54
This is some information about how to use/trade Stochastics indicatorTrading with Stochastics :
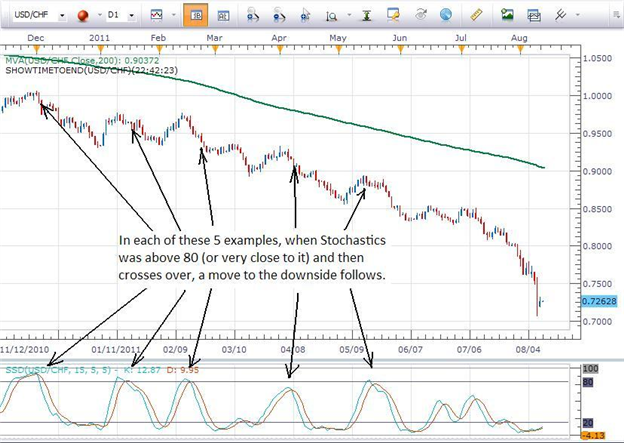
Stochastics gives its strongest sell signal when the two moving averages that comprise it have first been above 80 and then close below the 80 level. The strongest buying signal is given when the two moving averages have first been below 20 and then close above 20.
Ideally, we should use Stochastics, and any other indicator for that matter, only to take trades in the direction of the Daliy trend. So if a trader determines that a pair is in an uptrend, they would then consult Stochastics to time their entry after Stochastics has been below 20 and then closed above the 20 level. In a downtrend, such as we have on the Daily chart of the USDCHF below, they would look for Stochastics to have been above 80 and then close below it for the signal to sell the pair.
See the chart below for an example of this :
For Stochastics to close below 80 in a downtrend or above 20 in an
uptrend is a much stronger signal than if Stochastics simply goes above
or below those levels during the course of the time that the candle is
open.
For example, let's say that a trader is using a 1 hour chart. When that 1
hour candle closes at the end of the hour, the trader can check
Stochastics to see if the two moving averages were above 20 or below 80
after the close occurred. That will confirm that the indicator did
indeed close above or below the requisite level.
Forum on trading, automated trading systems and testing trading strategies
newdigital, 2013.07.19 09:16
Slow Stochastics versus Fast Stochastics :Developed by George C. Lane in the late 1950s, the Stochastic Oscillator is a momentum indicator that shows the location of the current close relative to the high/low range over a certain number of periods.
New traders typically want to know the difference between Fast Stochastics and Slow Stochastics. They also want to know whether the typical default settings of 5,5 (Fast Stochastics) or 5,5,5 (Slow Stochastics) as seen in most charting packages developed for FX are better or worse than the typical default settings of 14,3 (Fast Stochastics) or 14,3,3 (Slow Stochastics) seen in stock and futures charting packages.
First of all, the difference between Fast Stochastics and Slow Stochastics is just a moving average.
When calculating Fast Stochastics using the values of 5 and 5, the first “5” is the raw value for Stochastics, while the second “5” is a 5-period moving average of the first “5”. When using Slow Stochastics, the first two 5’s are the same as with the Fast Stochastics, with the third “5” being a moving average of the second “5”. Yes, that’s right, a moving average of the moving average. This slows the movement of the indicator down even further, hence the name of Slow Stochastics.
By slowing the movement of the indicator down, we will see fewer signals
to buy or sell on the chart, but they should be more reliable signals.
By using a larger value in calculating the raw value of Stochastics, we
slow the indicator down even more. This is why I recommend to traders
using FX charts to use the Slow Stochastics with values of 15,5,5. This
combination offers fairly reliable signals that can offer solid entries
into trading opportunities. The chart below shows the difference between
Fast Stochastics with values of 5,5 compared to Slow Stochastics with
values of 15,5,5.
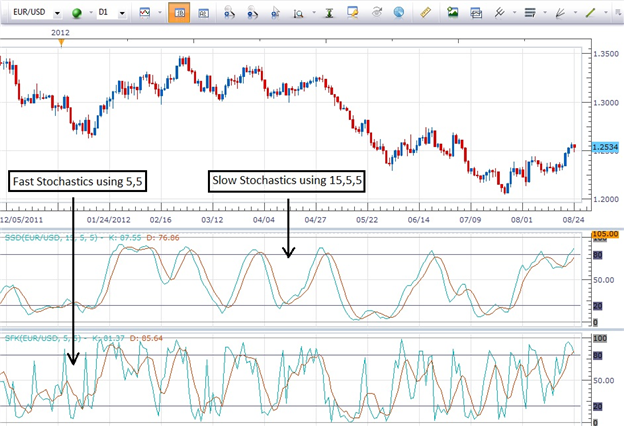
You can see how much easier it is to identify the signals using the Slow
Stochastics. Being able to use the technical tool effectively is most
of the battle. By keeping things simple and consistent, we should start
to see consistent results in our trading.
As with all indicators, entering a trade only when the indicator
generates an entry that is in the direction of the trend can result in a
higher probability of success.
Forum on trading, automated trading systems and testing trading strategies
Market Condition Evaluation based on standard indicators in Metatrader 5
newdigital, 2013.02.12 16:44
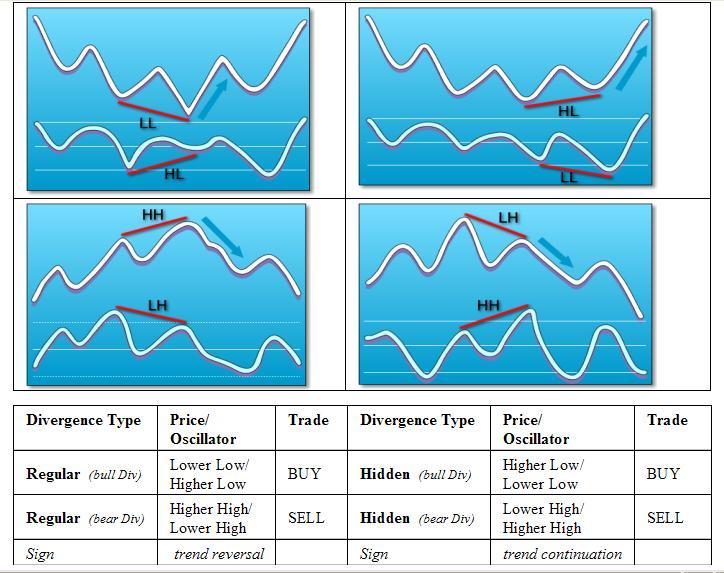
I promissed here to describe something about divergence. yes, it is related to this thread Market Condition Evaluation based on standard indicators in Metatrader 5
We can write about divergence from the following sources:
Forum on trading, automated trading systems and testing trading strategies
Market Condition Evaluation based on standard indicators in Metatrader 5
newdigital, 2013.02.12 16:45
Or ... to make it shorter - we can see the rules from the image:
Forum on trading, automated trading systems and testing trading strategies
newdigital, 2013.06.01 18:29
I decided to make some indicators' review based on trading experience and using them inside manual trading systems. So, please find the first thread about Stochastic Oscillator.
Feel free to add or write any comments concerning this indicator about how to use it inside trading systes, how to trade using this indicator and so on.
===============
Sto.chas.tic (sto kas'tik) adj. 2. Math. designating a
process having an infinite progression of jointly distributed random
variables.
--- Webster's New World Dictionary
===============
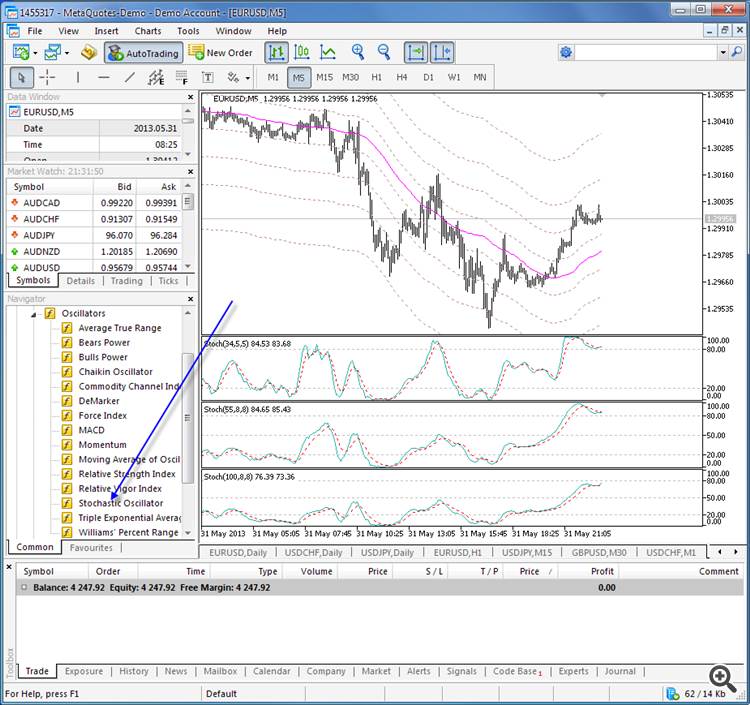
Stochastic is default/standard indicator in Metatrader 5 and it is located right here (look at the image):
===============
From Achelis "Technical Analysis from A to Z" :
Interpretation
The Stochastic Oscillator is displayed as two lines. The main line is called "%K." The second line, called "%D," is a moving average of %K. The %K line is usually displayed as a solid line and the %D line is usually displayed as a dotted line.
There are several ways to interpret a Stochastic Oscillator. Three popular methods include:
-
Buy when the Oscillator (either %K or %D) falls below a specific level (e.g., 20) and then rises above that level. Sell when the Oscillator rises above a specific level (e.g., 80) and then falls below that level.
-
Buy when the %K line rises above the %D line and sell when the %K line falls below the %D line.
Look for divergences. For example, where prices are making a series of new highs and the Stochastic Oscillator is failing to surpass its previous highs.
===============
More detailed explanation about this indicator we can see from this small article (from MT5 documentation/help file): Stochastic Oscillator
And full description about this indicator concerning trading signals - read this very small article: Signals of the Oscillator Stochastic
Forum on trading, automated trading systems and testing trading strategies
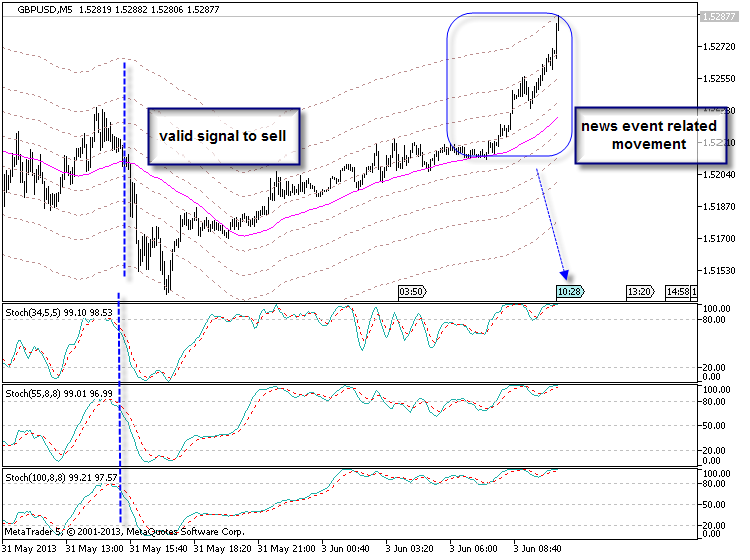
newdigital, 2013.06.03 10:38
This is the real example about valid signal based on Stochastic, and some movement which is related to news event for now. We will come back to this image later but I think - it is good example about the following "news events are not our friends" :)
- Free trading apps
- Over 8,000 signals for copying
- Economic news for exploring financial markets
You agree to website policy and terms of use