Join our fan page

KCI Standard: A Pure Kinematic Computing Engine for Market Singularity Detection - indicator for MetaTrader 5

- Views:
- 384
- Rating:
- Published:
-
 You are missing trading opportunities:
- Free trading apps
- Over 8,000 signals for copying
- Economic news for exploring financial markets
Registration Log inYou agree to website policy and terms of use
If you do not have an account, please register -
 Need a robot or indicator based on this code? Order it on Freelance
Go to Freelance
Need a robot or indicator based on this code? Order it on Freelance
Go to Freelance
Abstract
The Kinetic Compression Index (KCI) Standard is a high-performance, purely mathematical oscillator designed to detect extreme market exhaustion and volumetric compression points known as "Singularities." By abandoning traditional, lagging indicator handles in favor of native kinematic calculations, KCI offers unparalleled execution speed and CPU efficiency. This article details the mathematical foundation, system architecture, core code mechanics, and practical integration guides for developers looking to implement this asynchronous-proof engine into Expert Advisors and Custom Indicators.
Introduction
In the realm of algorithmic trading, precision and computational efficiency are paramount. Most conventional indicators suffer from inherent lag due to their reliance on smoothed averages. When incorporated into Expert Advisors—especially multi-currency or grid-based systems running on virtual private servers (VPS)—calling multiple standard indicator handles can cause memory bloat, execution delays, and critical missed entries. Problem Statement
Traders and developers constantly face three critical bottlenecks:
-
Indicator Lag: Traditional oscillators react too slowly to sudden volumetric spikes and price deviations.
-
CPU Overhead: Repeatedly calling external handles via iCustom or native MQL5 functions strains server resources.
-
Thread Desynchronization: EAs running asynchronously often miss live market entries because traditional custom indicators take too many milliseconds to calculate on new, fast-moving ticks.
Objectives
The KCI Standard was engineered from the ground up to solve these specific architectural flaws.
The primary goals are to:
-
Completely eliminate the use of external indicator handles (zero MA dependency).
-
Calculate market kinematics directly from raw price and tick volume.
-
Provide a polarized, visually intuitive oscillator ranging from -100 to +100.
-
Expose clean, zero-lag signal buffers specifically built to survive asynchronous tick threading for EA integration.
Theory / Concepts
KCI is built upon four fundamental pillars of market kinematics, bypassing traditional technical analysis constructs:
-
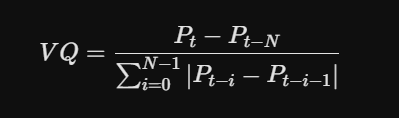
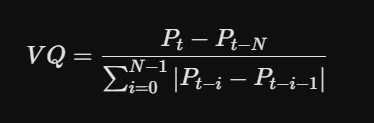
Velocity Quotient (VQ): The kinetic efficiency of the price trajectory.
-
Kinetic Displacement (KD): The absolute center of mass deviation, providing pure convergence readings.
-
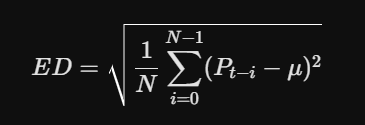
Energy Dispersion (ED): Pure standard deviation utilized as a proxy for spatial market volatility.
-
Phase Velocity (PV): Unfiltered linear momentum measuring immediate market thrust.
-
Singularity: A mathematical anomaly where directional velocity collapses while volume pressure drops, signaling an imminent absolute reversal.
System Architecture
The KCI engine processes raw market data through a streamlined, multi-phase pipeline managed entirely within a single file:
-
Data Ingestion (Raw Price & Volume Data)
-
Phase 1: Pure Kinematics (VQ, KD, ED, PV)
-
Phase 2: Z-Score Normalization & Exponential Polarization
-
Phase 3: Cognitive Validation (Singularity Detection)
-
Final Output: Polarized Visuals & EA Signal Buffers
Project Structure
The indicator is compiled as a single KCI.mq5 file, ensuring maximum portability. It utilizes a highly optimized internal buffer structure managed entirely by the MetaTrader 5 terminal ( INDICATOR_CALCULATIONS ), preventing memory leaks and array-out-of-bounds errors during prolonged operation.Input Parameters
| Parameter | Function | Default |
|---|---|---|
| ZScore Period | The rolling window used to normalize the kinematic matrices. | 50 |
| Compression Threshold | The mathematical threshold for detecting extreme exhaustion (Singularity). | 2.0 |
| Base Period | The lookback period for raw kinematic calculations. | 14 |
| -------------------- | *Additional custom settings if the indicator is used Directly | ------- |
| Color Above Zero | The visual line color when momentum is Bullish. | Dodger Blue |
| Color Below Zero | The visual line color when momentum is Bearish. | Red |
Enumerations & Data Structures
KCI avoids complex external objects to maintain its ultra-lightweight footprint. Its architecture relies on a strict, unalterable array mapping framework.
Exposed Buffers (For EA/Visuals):
-
Buffer 0 : Main Polarized Line (Visual Data)
-
Buffer 1 : Line Color Index (Dynamic color mapping)
-
Buffer 2 : Bullish Singularity Signal (Value 1.0 = Buy)
-
Buffer 3 : Bearish Singularity Signal (Value 1.0 = Sell)
Internal Buffers (Engine Core):
-
Buffer 4-8 : Internal Kinematic Matrices (VQ, KD, ED, PV, Raw_KCI)
Algorithm Workflow
- Dynamic Warm-Up: The system calculates available history to prevent crashing on newly listed assets.
- Kinematic Calculation: Computes the baseline physics of the market.
- Z-Score Normalization: Standardizes the vectors to compare them evenly.
- Matrix Summation: Sums the absolute differences to locate extreme matrix compression.
- Polarization: Applies exponential decay to project the raw sum onto a visually intuitive +/- 100 scale.
- Signal Generation: Validates local minimums (V-shapes) coupled with energy exhaustion drops.
Calculation Logic
The engine replaces traditional indicators with native mathematical equivalents:
| Velocity Quotient (VQ) : | Kinetic Displacement (KD) : | Energy Dispersion (ED): |
 |  |  |
Polarized Exponential Decay: To ensure the absolute compression values map elegantly to a traditional oscillator view, an exponential decay function is applied, dynamically mapped by constant k :

Implementation Details & Code Walkthrough
The Dynamic Z-Score Matrix
Unlike standard indicators that fail if historical bars are missing, KCI dynamically adjusts its Z-Score window. It can begin plotting with as few as 17 bars, making it flawless for newly IPO'd stocks or fresh cryptocurrencies.
int available_bars = (rates_total - BasePeriod) - i;
int dynamic_z_period = available_bars;
if(dynamic_z_period > ZScorePeriod) dynamic_z_period = ZScorePeriod;
Algorithm Workflow & Code Walkthrough
The KCI engine processes data in specific phases. Below are the critical code sections that make this engine highly robust.
- The Polarized Exponential Decay (Phase 2)
To ensure the absolute compression values map elegantly to a traditional oscillator view, an exponential decay function is applied. This translates raw kinetic matrix sums into a clean +/- 100 scale.
// Mathematical constant to map the threshold precisely to the 80.0 level
// Formula: k = -ln(0.8) / Threshold
double decay_constant = 0.22314355 / CompressionThreshold;

// Summing the Z-Score matrix differences
Raw_KCI[i] = dist1 + dist2 + dist3 + dist4 + dist5 + dist6;

// VISUAL MAPPING: Polarized KCI Oscillator
double direction = (buf_kd[i] >= 0) ? 1.0 : -1.0;
KCI_Buffer[i] = 100.0 * MathExp(-decay_constant * Raw_KCI[i]) * direction;
The Asynchronous-Proof Cognitive Validation (Phase 3)
A major flaw in MQL5 custom indicators is failing during live forward testing because the limit integer drops to 0 on new ticks. KCI uses rates_total - 2 as an absolute safety net, ensuring EA signal generation runs flawlessly on live environments. It also features a Zero-Volume fallback for illiquid market moments.
if(i < rates_total - 2)
{
    // Local Minimum & Threshold Detection
    bool is_local_min = (Raw_KCI[i+1] < Raw_KCI[i]) && (Raw_KCI[i+1] < Raw_KCI[i+2]);
    bool is_extreme   = (Raw_KCI[i+1] <= CompressionThreshold);

    // Zero-Volume Protection
    double vol_t1 = (tick_volume[i+1] > 0) ? (double)tick_volume[i+1] : 1.0;
    double vol_t  = (tick_volume[i] > 0)   ? (double)tick_volume[i]   : 1.0;

    // Energy Exhaustion Validation
    double E_t1 = vol_t1 * MathPow(close[i+1] - close[i+2], 2);
    double E_t  = vol_t  * MathPow(close[i] - close[i+1], 2);

    if(is_local_min && is_extreme && (E_t1 < E_t))
    {
        if(close[i+1] - close[i+2] < 0) Bullish_Buffer[i+1] = 1.0;
        else Bearish_Buffer[i+1] = 1.0;
    }
}
How to Use & EA Integration
For Manual Traders:
Wait for the KCI line to pierce the Premium (+80) or Discount (-80) levels. Do not trade immediately upon touch. Wait for the indicator to form a sharp "V" or inverted "V" peak; this validates the Singularity and the kinetic exhaustion.
For EA Developers:
When calling KCI via iCustom , ensure your EA's OnTick handler accounts for asynchronous thread loading.
// ASYNCHRONOUS HANDLING: If KCI is still calculating, return and try again next tick.
// Buffer Index 2 = Buy, Index 3 = Sell, Index 6 = Energy Dispersion
if(CopyBuffer(handle_kci, 2, 1, 1, buf_buy) <= 0) return;
if(CopyBuffer(handle_kci, 3, 1, 1, buf_sell) <= 0) return;
if(CopyBuffer(handle_kci, 6, 1, 1, buf_ed) <= 0) return;

// Lock the bar time ONLY after data is safely retrieved
last_bar_time = current_time;

// You can use buf_ed (Energy Dispersion) to calculate dynamic, volatility-based Stop Losses.
Calling KCI from an EA requires handling asynchronous threads. Because KCI performs heavy matrix math, the EA must gracefully wait if CopyBuffer returns a delayed result, without locking the last_bar_time .
EA Code Snippet:
#include <Trade\Trade.mqh>
CTrade trade;
int handle_kci;
datetime last_bar_time = 0;
double buf_buy[], buf_sell[], buf_ed[];

int OnInit()
{
    // Initialize KCI Handle (Assuming defaults: 50, 2.0, 14)
    handle_kci = iCustom(_Symbol, _Period, "KCI", 50, 2.0, 14);

    ArraySetAsSeries(buf_buy, true);
    ArraySetAsSeries(buf_sell, true);
    ArraySetAsSeries(buf_ed, true);
    return(INIT_SUCCEEDED);
}

void OnTick()
{
    datetime current_time = (datetime)SeriesInfoInteger(_Symbol, _Period, SERIES_LASTBAR_DATE);
    if(current_time == last_bar_time) return;

    if(PositionsTotal() > 0) return; // Sniper mode (1 trade at a time)

    // ASYNCHRONOUS HANDLING: If KCI is still calculating, return and try again next tick.
    // Notice that buffer indexes are shifted due to the visual Color Buffer in the indicator.
    // Index 2 = Buy, Index 3 = Sell, Index 6 = Energy Dispersion
    if(CopyBuffer(handle_kci, 2, 1, 1, buf_buy) <= 0) return;
    if(CopyBuffer(handle_kci, 3, 1, 1, buf_sell) <= 0) return;
    if(CopyBuffer(handle_kci, 6, 1, 1, buf_ed) <= 0) return;

    // Only lock the time AFTER data is successfully copied
    last_bar_time = current_time;

    double dynamic_volatility = buf_ed[0];
    if(dynamic_volatility == 0) return;

    // Execution Logic with Dynamic Volatility Stop Loss
    if(buf_buy[0] == 1.0)
    {
        double ask = SymbolInfoDouble(_Symbol, SYMBOL_ASK);
        double sl = ask - (dynamic_volatility * 1.5); // SL based on KCI Energy Dispersion
        double tp = ask + (dynamic_volatility * 3.0);
        trade.Buy(0.01, _Symbol, ask, sl, tp, "KCI Buy");
    }

    if(buf_sell[0] == 1.0)
    {
        double bid = SymbolInfoDouble(_Symbol, SYMBOL_BID);
        double sl = bid + (dynamic_volatility * 1.5);
        double tp = bid - (dynamic_volatility * 3.0);
        trade.Sell(0.01, _Symbol, bid, sl, tp, "KCI Sell");
    }
}
Integrating KCI into a Custom Indicator
When building a custom dashboard or an Arrow Indicator, you can pair KCI with a trend filter (like EMA or Bollinger Bands) to filter out counter-trend signals.
Custom Indicator Code Snippet (Arrow Plotting):
int handle_kci;
int handle_ema;
double buf_kci_buy[], buf_ema[];

int OnInit()
{
    // Set up your arrow buffers here...
    handle_ema = iMA(_Symbol, _Period, 50, 0, MODE_EMA, PRICE_CLOSE);
    handle_kci = iCustom(_Symbol, _Period, "KCI", 50, 2.0, 14);

    ArraySetAsSeries(buf_kci_buy, true);
    ArraySetAsSeries(buf_ema, true);
    return(INIT_SUCCEEDED);
}

int OnCalculate(const int rates_total, const int prev_calculated, const datetime &time[], const double &open[], const double &high[], const double &low[], const double &close[], const long &tick_volume[], const long &volume[], const int &spread[])
{
    int limit = rates_total - prev_calculated;
    if(prev_calculated == 0) limit = rates_total - 50;

    // Fetch background engine data OUTSIDE the main loop for extreme speed
    if(CopyBuffer(handle_ema, 0, 0, limit + 1, buf_ema) <= 0) return 0;

    // Fetch Buy Signal from KCI (Buffer Index 2)
    if(CopyBuffer(handle_kci, 2, 0, limit + 1, buf_kci_buy) <= 0) return 0;

    for(int i = limit; i >= 0 && !IsStopped(); i--)
    {
        // Double Confirmation: KCI detects exhaustion AND Price is above EMA (Uptrend)
        if(buf_kci_buy[i] == 1.0 && close[i] > buf_ema[i])
        {
            // Draw Buy Arrow below the low
            ArrowBuffer[i] = low[i] - (10 * _Point);
        }
    }
    return(rates_total);
}
Visualization & User Interface
The KCI Standard utilizes #property indicator_leveltext to provide a clean, polarized visual interface categorized by institutional trading concepts (Smart Money Concepts):
-
Upper Zone (+80): "Premium" – Kinetic energy is heavily overextended to the upside.
-
Center Line (0): "Equilibrium" – The market is traversing its natural kinetic center.
-
Lower Zone (-80): "Discount" – Extreme downward overextension.
The line dynamically shifts between clrDodgerBlue (Bullish) and clrRed (Bearish) the moment it crosses the Equilibrium, severely reducing cognitive load for manual traders.
Performance Optimization
- Zero Repainting: The cognitive engine only validates a Singularity on definitively closed candles ( i+1 and i+2 ).
- Automated Memory: Array sizing is delegated entirely to the MT5 terminal via INDICATOR_CALCULATIONS .
- Execution Profile: CPU usage drops to near-zero as KCI calculates only the active bar after the initial historical load.
Advantages & Limitations
Advantages:
- Ultra-Fast: Zero external moving average handles.
- Adaptive Volatility: Exposes mathematical spatial dispersion (ED Buffer) to EAs for dynamic SL/TP calculation, acting as a vastly superior alternative to ATR.
- Asynchronous-Safe: Guaranteed to deliver signals to EAs during violent tick movements.
Limitations:
- Requires a minimum of BasePeriod + 3 bars of history to generate the very first visual plot.
- As an extreme mean-reversion tool, it operates best when paired with a macro-trend filter (like EMA crossovers or Bollinger Bands).
Future Development
The roadmap for KCI involves integrating an auto-optimizing Neural Filter. This future update will allow the algorithm to dynamically adjust its CompressionThreshold based on the specific historical tick volume anomalies of individual assets using localized machine learning. Conclusion
The Kinetic Compression Index represents a paradigm shift in technical indicator design. By analyzing the relationships between multiple kinematic metrics rather than a single dimension of price action, KCI provides a more holistic view of market structure.
The Polarized Oscillator visualization (-100 to +100 with OB/OS at ±80) makes it accessible to traders familiar with RSI or Stochastic, while the underlying mathematics provide a robust, adaptive framework that conventional oscillators lack.
The Cognitive Validation Engine – combining local minima detection, extreme condition checking, and energy analysis – effectively filters out false signals, making KCI suitable for both manual trading and automated Expert Advisors.
The Energy Dispersion (ED) buffer adds unique value by providing a dynamic volatility measure that can be directly used for position sizing, stop-loss placement, and take-profit targeting – bridging the gap between signal generation and risk management.
KCI is not just an indicator; it is a universal core that can serve as the foundation for a wide range of trading systems, from simple entry signals to complex multi-symbol dashboards.
Frequently Asked Questions (FAQ)
Q: Why does KCI show EMPTY_VALUE on some bars?
A: KCI requires at least BasePeriod + 3 bars to begin calculation. Bars before this threshold display EMPTY_VALUE .
Q: Are the signals repainting?
A: No. Signals are written to Bullish_Buffer[i+1] and Bearish_Buffer[i+1] only after the bar at index i+1 is confirmed. Once written, they never change.
Q: What timeframe works best with KCI?
A: KCI works on all timeframes. Shorter timeframes (M1-M15) produce more signals but with lower reliability. Higher timeframes (H1-D1) produce fewer but more reliable signals.
Q: How do I interpret the ED value for SL/TP?
A: ED represents the standard deviation of prices over the BasePeriod. A common approach is SL = ED × 1.5 and TP = ED × 3.0. Adjust multipliers based on your risk tolerance.
Q: Can I use KCI with other indicators?
A: Yes. KCI can be combined with trend filters (e.g., MA, ADX) or momentum confirmations (e.g., iRSI, iMACD) to create more sophisticated strategies.
Q: Why does the visual KCI sometimes show values outside -100/+100?
A: The theoretical range is -100 to +100, but due to floating-point precision, values may slightly exceed these bounds. The indicator automatically clamps values in practice.
Q: What happens if I change the CompressionThreshold?
A: Lower values (e.g., 1.5) produce more signals but with higher false-positive rates. Higher values (e.g., 3.0) produce fewer but more reliable signals. The visual OB/OS level at ±80 automatically adjusts.
Version History (Changelog)
Version 1.0 (Current): Initial Public Release. Features Polarized Oscillator implementation, Dynamic Z-Score Matrix, Color-Coded Equilibrium Crossing, and Asynchronous EA-Ready Signal Buffers.
 Custom")
References
-
MQL5 Documentation – MetaQuotes Ltd.
https://www.mql5.com/en/docs -
Technical Analysis of Financial Markets – John J. Murphy
New York Institute of Finance, 1999 -
Market Physics: The Kinetic Approach to Technical Analysis – Various academic papers on applying physics concepts to financial markets
-
Z-Score Normalization in Quantitative Finance – Standard statistical methodology for standardizing data
-
Energy and Momentum in Financial Time Series – Research on the relationship between price velocity, volume, and market turning points
-
MQL5 Programming for Traders – Articles and tutorials on the MQL5.community
Appendix A: Complete KCI Source Code
(The full source code is provided in the article above, with detailed comments explaining each section.)Appendix B: Buffer Index Reference
| Buffer Index | Buffer Name | Data Type | Purpose |
|---|---|---|---|
| 0 | KCI_Buffer | INDICATOR_DATA | Visual Polarized Oscillator |
| 1 | Bullish_Buffer | INDICATOR_CALCULATIONS | Buy Signal (1.0 = signal) |
| 2 | Bearish_Buffer | INDICATOR_CALCULATIONS | Sell Signal (1.0 = signal) |
| 3 | buf_vq | INDICATOR_CALCULATIONS | Velocity Quotient (internal) |
| 4 | buf_kd | INDICATOR_CALCULATIONS | Kinetic Deviation (internal) |
| 5 | buf_ed | INDICATOR_CALCULATIONS | Energy Dispersion (ED – for SL/TP) |
| 6 | buf_pv | INDICATOR_CALCULATIONS | Pure Velocity (internal) |
| 7 | Raw_KCI | INDICATOR_CALCULATIONS | Raw KCI (internal) |
Market Structure SMC: Swings, BOS/CHoCH, Order Blocks, FVG, QML
SMC/ICT market-structure indicator for MT5: swing highs/lows, BOS (continuation) and CHoCH (reversal) confirmed on close, Order Blocks, Fair Value Gaps, and QML (Quasimodo) levels. Every feature is toggle-able, with adjustable swing sensitivity and colors. Works on any symbol and timeframe.
 Trade Journal Exporter - closed positions to CSV
Exports your closed positions for a configurable period to a CSV file for journal analysis in Excel or Google Sheets: entry and exit time and price (volume-weighted over partial fills), volume, result in points, commission, swap, net profit and trade duration.
 EA KCI Embeded Sniper
The KCI Embedded Sniper is an algorithmic trading solution designed for high-precision reversal entries. Unlike conventional Expert Advisors that rely on external indicator dependencies (which often suffer from thread desynchronization and latency), this EA features a fully embedded Kinetic Compression Index (KCI) engine. By transplanting the entire mathematical framework of the KCI—calculating Velocity Quotients, Kinetic Displacement, Energy Dispersion, and Phase Velocity—directly into the EA’s core logic, we have eliminated "asynchronous lag." The result is a lightning-fast sniper engine that validates market exhaustion (Singularity) and momentum extremes (Williams %R) with micro-second precision, operating solely on completed bars to ensure zero-repaint performance.
MACD Signals
Indicator edition for new platform.