Join our fan page

Baseline: iMA + ATR Bands - indicator for MetaTrader 5

- Views:
- 6277
- Rating:
- Published:
-
 You are missing trading opportunities:
- Free trading apps
- Over 8,000 signals for copying
- Economic news for exploring financial markets
Registration Log inYou agree to website policy and terms of use
If you do not have an account, please register -
 Need a robot or indicator based on this code? Order it on Freelance
Go to Freelance
Need a robot or indicator based on this code? Order it on Freelance
Go to Freelance
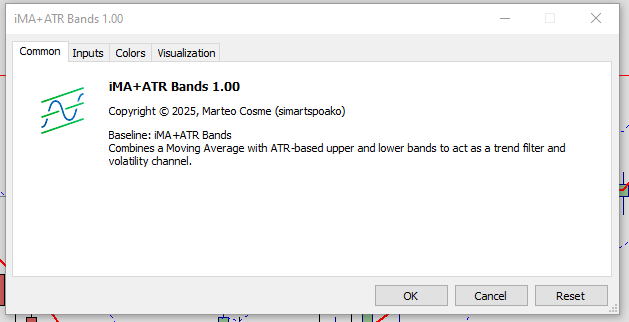
Indicator Name : Baseline: iMA + ATR Bands
Description :
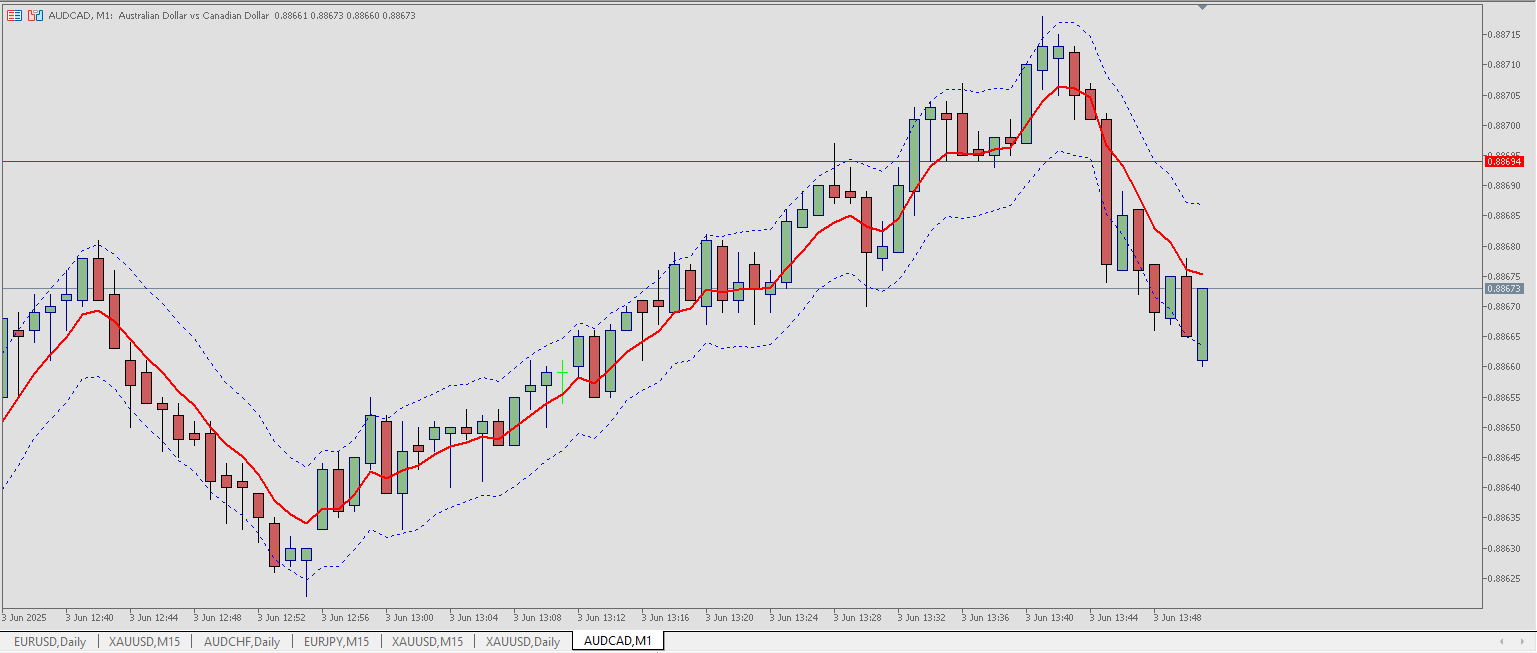
Baseline: iMA+ATR Bands is a custom indicator that combines a standard Moving Average (MA) with upper and lower bands based on the Average True Range (ATR). The result is a simple yet powerful visual tool for identifying market trends, potential breakouts, and volatility.
Background :
This indicator was inspired by the No Nonsense Forex (NNFX) trading methodology, where the Baseline acts as a primary trend filter. I developed this to make the baseline setup easier to read and interpret directly on the chart.
How to use :
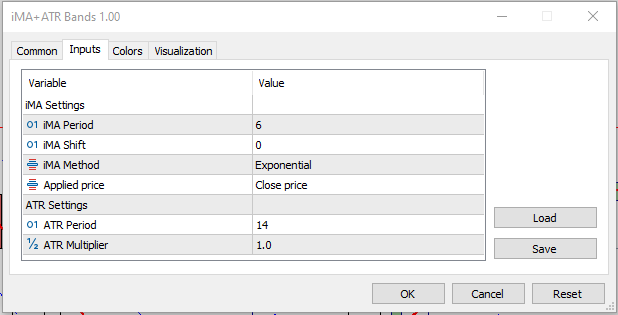
- iMA Period – The number of bars used to calculate the Moving Average.
- iMA Method – Type of Moving Average (SMA, EMA, SMMA, LWMA).
- Applied Price – Source price for MA (e.g., Close, Open, High, Low).
- ATR Period – Number of bars used for ATR calculation.
- ATR Multiplier – The factor applied to the ATR value to calculate the upper and lower bands.
Trading Suggestions (not financial advice) :
-
Use the MA line as your baseline trend filter.
-
Price crossing above the upper band may suggest bullish momentum.
-
Price crossing below the lower band may indicate bearish momentum.
-
Combine with confirmation, volume, and exit indicators in line with your strategy (e.g., NNFX guidelines).
Screenshots :
Input Settings :
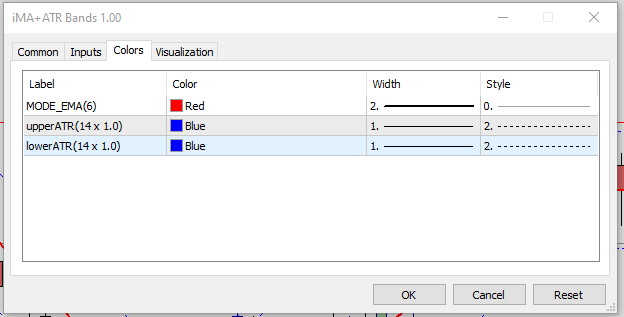
Color & Lines Settings :
About :
Show Positions on Custom Chart (or standard chart) for MT5
This indicator is a utility that shows labelled trade levels on any chart. If you want to replace your native trade levels on a native chart, then turn off "Show trade levels" in your F8 Chart Properties and attach this indicator. If you want to show trade levels on a Custom Chart (where native trade levels cannot be shown), then simply attach this indicator. BaseSymbol - specify the Symbol from which the trade level data will be pulled--handy for unique Custom Symbols. TextBarsBack - specify the number of bars back in history from the current bar where the level labels will be drawn. Note: Although magic number is referenced in the code, it is not presently included in the trade lines. If you're running multiple EA's on the same Symbol, you can edit the code to show magic numbers and then run multiple instances of the indicator on one chart. You can also edit the font sizes and text spacing in the object properties as needed for different display resolutions.
 Indicator based on 2 MAs
Good afternoon everyone) First time posting my code!!!
False Breakups
The "False Breakouts.mq5" indicator is a tool for MetaTrader 5 that visually identifies and marks buy and sell points based on false breakouts of support and resistance. It uses buffers to display buy (blue) and sell (red) arrows, as well as lines for support (blue) and resistance (red), and additional arrows for market tops and bottoms. The indicator's main logic consists of detecting tops and bottoms based on the high and low prices of the candles, dynamically updating support and resistance levels. When the price breaks through support or resistance and then returns, the indicator generates buy or sell signals respectively. It is a useful tool for traders who operate strategies based on false breakouts.
AlphaTrend
It is an indicator used to determine the trend, support and resistance level of the market. When volume data is available, it calculates using MFI, if not, it calculates using RSI. Momentum: RSI and MFI Volatility: ATR