Join our fan page
- Views:
- 6653
- Rating:
- Published:
-
Need a robot or indicator based on this code? Order it on Freelance Go to Freelance
Key Features
-
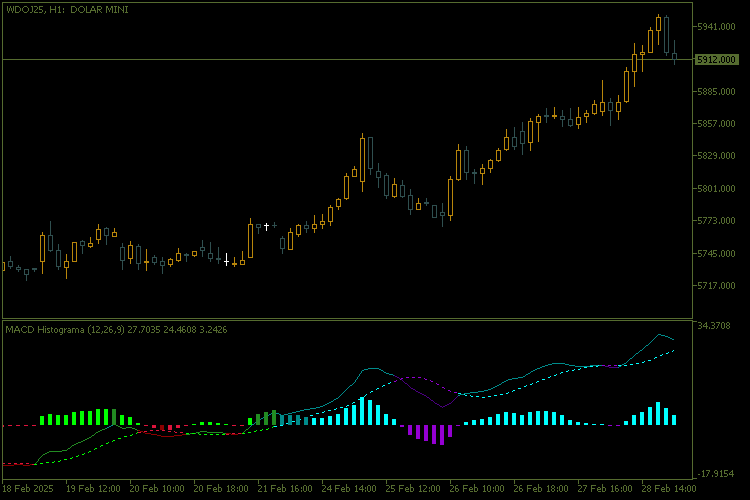
Dynamic and Coloured Histogram:
The histogram changes colour automatically based on market conditions, allowing you to view it at a glance:- When the MACD crosses above or below the signal line.
- When the MACD crosses above or below the zero line.
- The strength and direction of the trend.
-
Customisable Sound Alerts:
Receive real-time notifications whenever important crossings occur between the MACD and the signal line or when the MACD crosses the zero region. You can configure- The sound of the alert.
- The maximum number of repetitions.
- The minimum pause between alerts.
-
Configurable colours:
The indicator uses a rich and intuitive colour palette to highlight different states of the MACD, signal line and histogram. The colours are easy to interpret and help in making quick decisions. -
Customisable parameters :
- Periods of the fast and slow moving averages.
- Period of the signal moving average.
- Price applied to the calculation (close, open, maximum, minimum, etc.).
-
User-friendly interface:
The indicator is easy to set up and use, even for beginner traders. All parameters can be adjusted directly in the properties window.
How it works :
- The indicator calculates the difference between the MACD and its signal line, displaying the result as a coloured histogram.
- Different colours are used to represent crossovers, positive/negative trends and changes in momentum.
- Audible alerts are triggered when important events occur, such as line crossings or transitions between positive and negative regions.
Benefits :
- Quick Decision Making: With dynamic colours and sound alerts, you can react quickly to changes in the market.
- Full customisation: Adjust the parameters to suit your trading strategy.
- Clear Visualisation: The clean and intuitive design makes it easy to interpret the data, even on busy charts.
- Compatibility: Works perfectly on any asset and timeframe supported by MetaTrader 5.
Examples of use :
- Use the indicator to identify entry and exit points in trend strategies.
- Combine the MACD Colour Histogram with other indicators to confirm buy/sell signals.
- Monitor the histogram to detect divergences between price and momentum.

https://www.mql5.com/en/charts/20768335/wdoj25-h1-banco-btg-pactual
Translated from Portuguese by MetaQuotes Ltd.
Original code: https://www.mql5.com/pt/code/56382
 Candle Counter
Candle counter is a powerful and versatile tool designed to help traders visualise and analyse the sequence of bars on their charts. This indicator automatically numbers each candle on the chart based on user-defined preferences, making it easy to follow specific candles, identify patterns and implement precise trading strategies.
 Moving Average based on Heiken-Ashi
This is a Moving Average indicator based on Heiken-Ashi candles instead of raw market price.
 Candle size
The "Candle_size.mq5" indicator was developed to display the size of candles on the chart, providing a clear and detailed visual analysis of price movements. It calculates the difference between the high and low prices of each candle and displays the formatted value as text next to the corresponding candle. This feature is especially useful for traders who want to assess volatility or identify specific patterns of price behaviour.
 Moving Average x Relative Strength Indicator EA
A Simple RSI and Moving Average-Based Expert Advisor for MQL5