Join our fan page

Candle size - indicator for MetaTrader 5

- Views:
- 6643
- Rating:
- Published:
-
 You are missing trading opportunities:
- Free trading apps
- Over 8,000 signals for copying
- Economic news for exploring financial markets
Registration Log inYou agree to website policy and terms of use
If you do not have an account, please register -
 Need a robot or indicator based on this code? Order it on Freelance
Go to Freelance
Need a robot or indicator based on this code? Order it on Freelance
Go to Freelance
Main Ideas Incorporated in the Code
-
Candle Size Calculation :
- The indicator measures the amplitude of the candles (difference between high and low) and displays the value in points or pips.
- Different colours are used to distinguish bullish and bearish candles, making visual interpretation easier.
-
Customisation by Day of the Week :
- Allows you to process candles from a specific day of the week (e.g. Monday, Tuesday, etc.) or every day.
- It assigns unique colours to each day of the week, making it easy to observe daily patterns.
-
Dynamic Text Positioning :
- Text can be moved vertically in relation to the candle to avoid overlapping with other chart elements.
- Automatically adjusts the position of the text to remain within the visible limits of the chart.
-
Style and Formatting :
- The user can customise the font, font size, colour and anchor type of the text.
- Supports different line styles (e.g. dashed, dotted) for better visualisation.
-
Automatic Cleaning :
- When detaching the indicator from the chart, all objects created are automatically removed to keep the chart clean.
Description of External Variables
All the user-configurable external variables are described below:
InpAmount | Number of numbered candles to be processed. |
InpMCConfigOptimistic | Optimistic calculation type (e.g. maximum). |
InpMCConfigPessimistic | Pessimistic calculation type (e.g. minimum). |
InpMCCorOptimistic | Colour for bullish candles. |
InpMCCorPessimistic | Colour for bearish candles. |
InpMCConfigFountain | Font of the text displayed on the chart. |
Sunday , Monday , etc. | Specific colours for each day of the week. |
InpStyle | Line style (e.g. dashed, dotted). |
InpWidth | Line width. |
textplace | Distance of the text from the top of the graph. |
InpFont | Font of the text displayed in the graph. |
InpFontSize | Font size. |
InpAnchor | Type of anchor for the text (e.g. top, bottom, centre). |
Recommended Instruments and Timeframes
- Instruments : This indicator can be used with any financial instrument available on the MetaTrader 5 platform, including currency pairs, indices, commodities and cryptocurrencies.
- Timeframes : It works on all timeframes, from 1-minute charts to weekly charts. However, it is recommended to use larger timeframes (e.g. H1, D1) to get a clearer and more accurate analysis of volatility.
Indicator interpretation
-
Candle size :
- A larger candle indicates greater volatility during the period.
- A smaller candle suggests less activity or consolidation in the market.
-
Colours :
- Bullish candles are displayed in a specific colour (e.g. gold).
- Bearish candles are displayed in another colour (e.g. grey).
-
Days of the week :
- Assigning different colours to each day of the week allows you to observe patterns in price behaviour on specific days.
Example of Practical Use
- Volatility Analysis : Helps traders identify days or periods with higher volatility based on the size of the candles.
- Daily Patterns : Processing candles from a specific day allows you to observe patterns of price behaviour on specific days.
- Decision Making : Provides quick visual insights into the strength of bullish and bearish movements, helping you make trading decisions.
Illustrative images
Figure 1: Example chart with the indicator applied. The colours differentiate bullish and bearish candles, while the text displays the size of each candle.
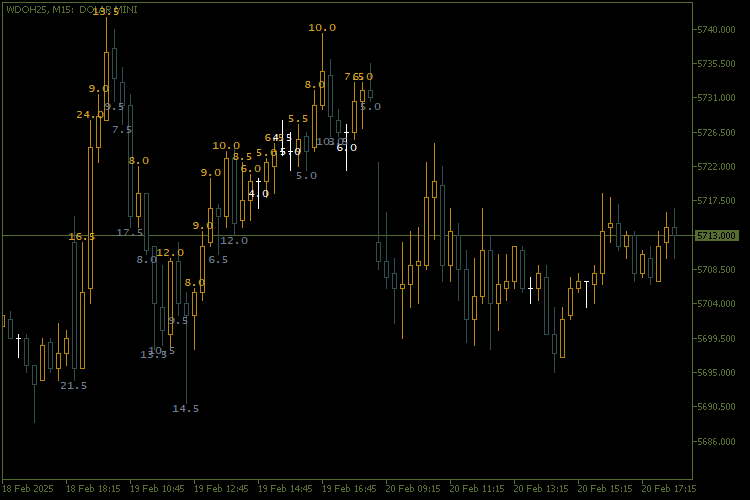
https://www.mql5.com/en/charts/20733290/wdoh25-m15-banco-btg-pactual
Translated from Portuguese by MetaQuotes Ltd.
Original code: https://www.mql5.com/pt/code/56281
MACD coloured histogram
The MACD Coloured Histogram is an enhanced version of the classic MACD (Moving Average Convergence Divergence) indicator, designed to provide a clearer and more intuitive visual analysis of market momentum. This indicator combines traditional MACD functionalities with a dynamic histogram that changes colour based on the relationship between the MACD Line and the Signal Line, allowing traders to quickly identify trends, reversal points and moments of indecision in the market.
Candle Counter
Candle counter is a powerful and versatile tool designed to help traders visualise and analyse the sequence of bars on their charts. This indicator automatically numbers each candle on the chart based on user-defined preferences, making it easy to follow specific candles, identify patterns and implement precise trading strategies.
 Moving Average x Relative Strength Indicator EA
A Simple RSI and Moving Average-Based Expert Advisor for MQL5
Price Time Scale
Custom time and price scale.