Join our fan page

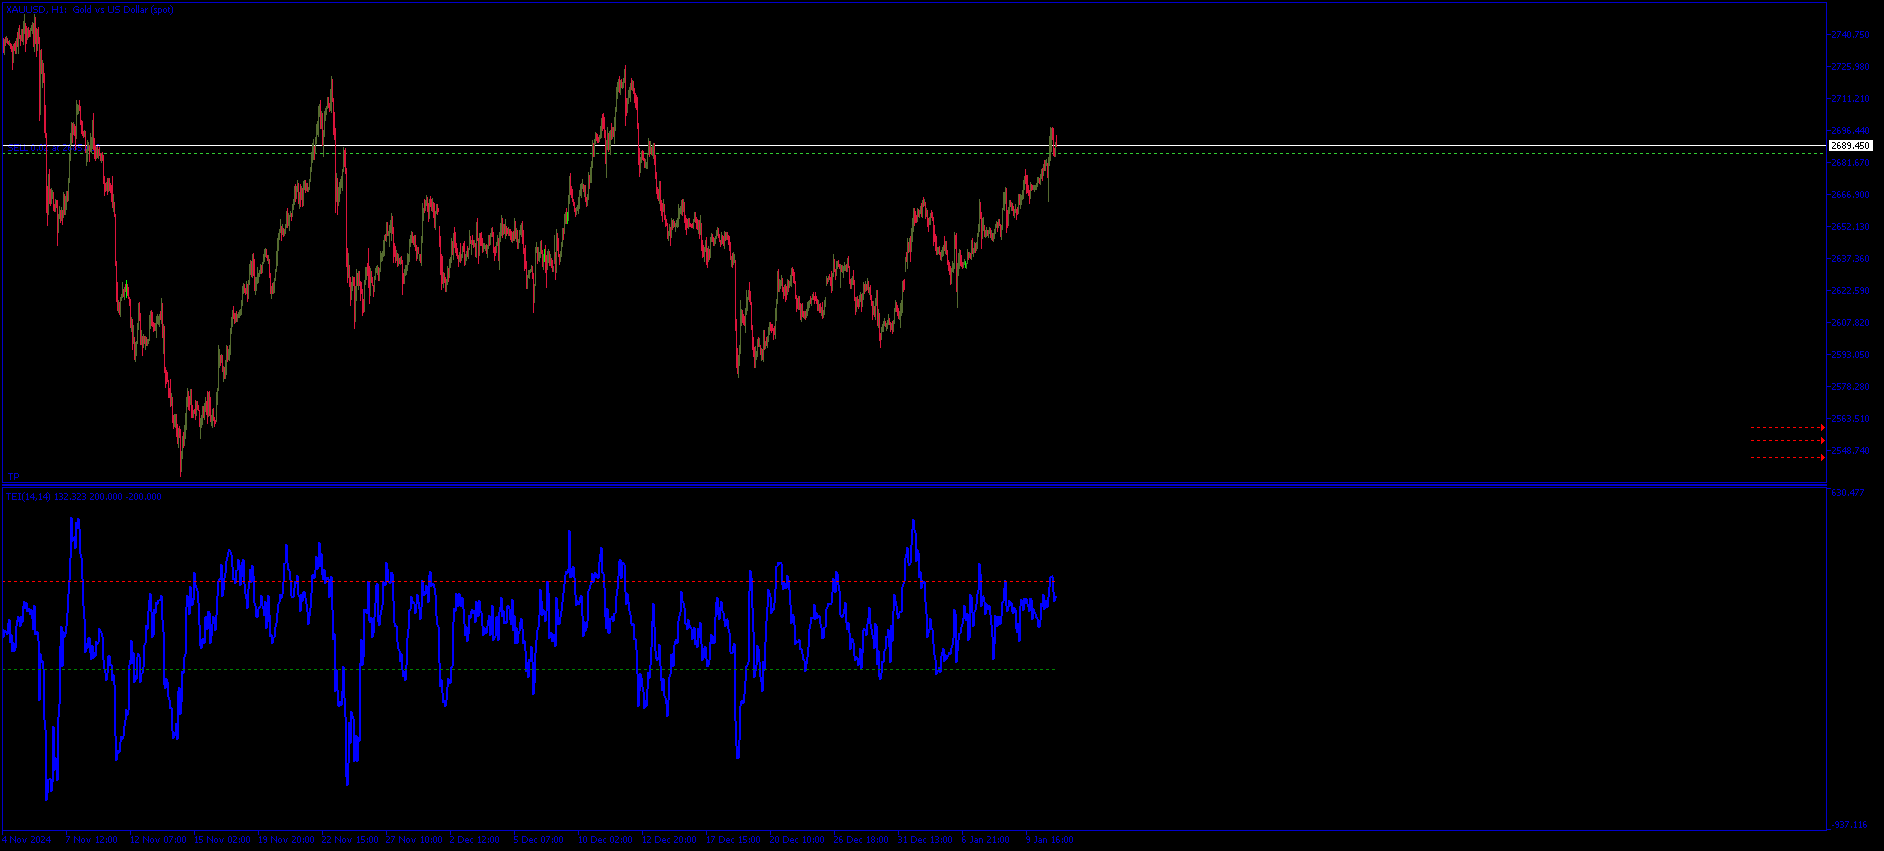
Trend Equilibrium Indicator TrendEQ - indicator for MetaTrader 5

Hi! I’m a developer with years of experience in software development.
Over the years, I’ve learned one essential truth:
Successful trading doesn’t require magic — it requires logic, stability, and clean code.
- Views:
- 6116
- Rating:
- Published:
- Updated:
-
 You are missing trading opportunities:
- Free trading apps
- Over 8,000 signals for copying
- Economic news for exploring financial markets
Registration Log inYou agree to website policy and terms of use
If you do not have an account, please register -
 Need a robot or indicator based on this code? Order it on Freelance
Go to Freelance
Need a robot or indicator based on this code? Order it on Freelance
Go to Freelance
Settings and Parameters
General Parameters
-
Momentum Period
The number of candles used to calculate momentum.
Recommended value: 14
(The higher the value, the smoother the curve, but with a lag.) -
Volatility Period
The number of candles used to calculate volatility.
Recommended value: 14 -
Scaling Factor
The scaling factor adjusts the indicator calculation to produce a readable curve.
Default value: 100000
Thresholds
-
Overbought Level
The value above which the market is considered overbought.
Default value: 100.0 -
Oversold Level
The value below which the market is considered oversold.
Default value: -100.0
Functions
-
Trend Determination:
- Positive values: Indicate upward momentum (bullish trend).
- Negative values: Indicate downward momentum (bearish trend).
-
Volatility Adjustment:
The indicator dynamically adjusts momentum calculations based on current market volatility, providing more accurate and timely signals. -
Overbought/Oversold Signals:
- Overbought: Indicates the price might soon correct.
- Oversold: Indicates the price might soon recover.
Candlestick patterns
This is a indicator displaying candlesticks patterns on a chart.
 Strategy report output into a chart
This script was developed for displaying saved Strategy report from the Strategy Tester into a chart.
 Symbol Swap Panel Utility
Symbol Swap Panel: Effortlessly switch the active symbol on your chart while simultaneously adding the new symbol to Market Watch. This tool ensures seamless integration and access to real-time market data, optimizing your trading workflow.
Checking the server time changes due to the daylight saving time (DST) changeover
Unfortunately, I discovered that some brokers are a bit sloppy with the server time change due to the daylight saving time (DST), which I did not expect and which surprised me a lot. Here is a script with which anyone can check their broker.