Join our fan page
- Views:
- 24493
- Rating:
- Published:
- Updated:
-
Need a robot or indicator based on this code? Order it on Freelance Go to Freelance
The idea of this indicator has been proposed by Bill Williams in his book "New Trading Dimensions: How to Profit from Chaos in Stocks, Bonds and Commodities".
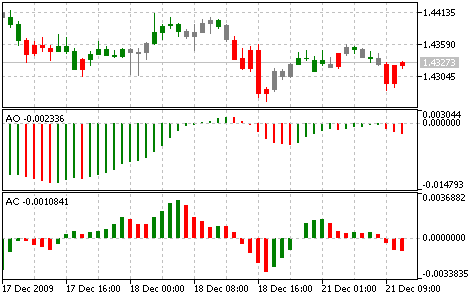
It shows the "fourth dimension" of the market - it paints the bar charts with different colors (green, grey and red) depending on the current market momentum (1st derivative) and price acceleration (2nd derivative), which calculated by Awesome Oscillator (AO) и Accelerator Oscillator (AC).

BW-ZoneTrade indicator
Calculation:
- if АС and АО are green, it means the green zone;
- if АС and АО are red, it means the red zone;
- if АС and АО have different colors, it means the grey zone.
Translated from Russian by MetaQuotes Ltd.
Original code: https://www.mql5.com/ru/code/17
 Bears Power
The Bears Power Indicator measures the balance of the bears strength.
 Bollinger Bands ®
The Bollinger Bands ® Indicator (BB) is similar to Envelopes. The only difference is that the bands of Envelopes are plotted a fixed distance (%) away from the moving average, while the Bollinger Bands are plotted a certain number of standard deviations away from it.
 Commodity Channel Index (CCI)
Commodity Channel Index (CCI) measures the deviation of the commodity price from its average statistical price.
 Chaikin Oscillator (CHO)
The Chaikin's Oscillator (CHO) is the difference of moving averages of Accumulation/Distribution.