
Quick Technical Overview - S&P 500: waiting for bearish/bullish direction of the trend
15 September 2015, 18:11

0
767
Weekly price is on ranging market condition located inside Ichimoku cloud between the bearish and the bullish area of weekly chart within the following key s/r levels:
- 2132.59 key resistance level located above Ichimoku cloud in the bullish area of the chart, and
- 1863.12 key support level located below Ichimoku cloud in the bearish area of the chart.
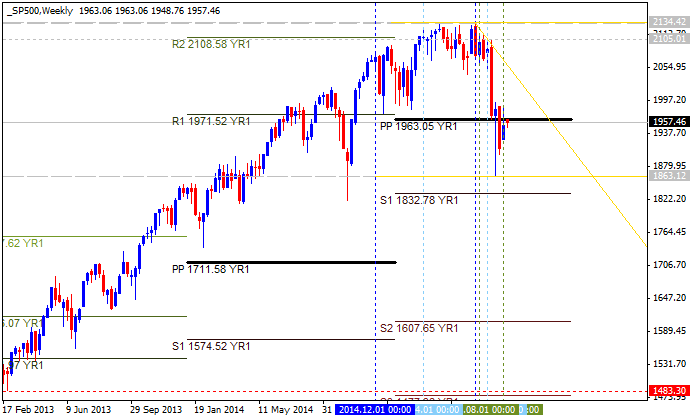
The price is located near Central YR1 Pivot at 1963.05 waiting for bearish/bullish direction of the trend:
- if the price will break this Central YR1 Pivot at 1963.05 from above to below on close weekly bar so we may see the bearish market condition for S&P 500;
- if the price will break Central YR1 Pivot from below to above on close weekly bar so the bullish trend will be continuing.
| Instrument | S1 Pivot | Yearly PP | R1 Pivot |
|---|---|---|---|
| SP 500 | 1832.78 | 1963.05 | 2188.18 |
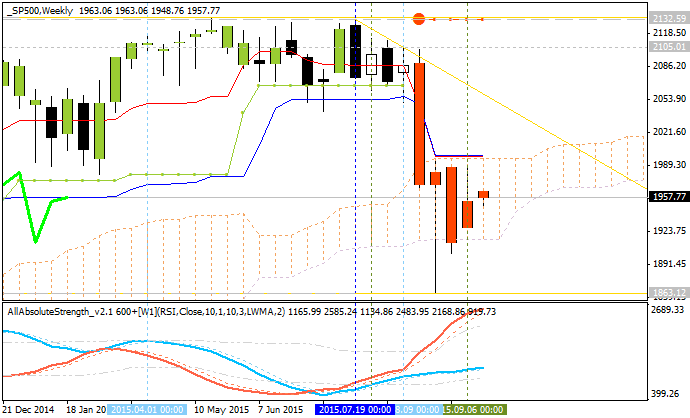
If W1 price will break 1863.12 support level on close W1 bar so we may see the reversal of the
price movement to the primary bearish market condition.
If W1 price will break 2132.59 resistance level on close W1 bar so the
bullish trend will be continuing.
If not so the price will be ranging within the levels.
Trend:
W1 - ranging


