• Typ des Indikators
  • Preis
     - 
  • Zurücksetzen
Schau das Lehrvideo über Market auf YouTube YouTube
Wie man einen Roboter oder Indikator kaufen kann
Starte Deinen EA im
Virtual Hosting
Teste einen Indikator/Roboter vor dem Kauf
Möchtest Du Geld im Market verdienen?
Wie man Produkte richtig präsentiert

Kostenpflichtige technische Indikatoren für den MetaTrader 5 - 7

icon Signale von technischen Indikatoren spielen eine entscheidende Rolle beim Eröffnen und Schließen von Geschäften auf den Aktien- und Devisenmärkten. Das Wesen von Indikatoren ist eine mathematische Transformation der Preise eines finanziellen Symbols, die darauf abzielt, zukünftige Preisänderungen vorherzusagen. Testen Sie technische Indikatoren, um das Marktverhalten besser vorherzusagen und davon zu profitieren.
Dieser Angebots- und Nachfragezonenindikator zeichnet die Zonen auf dem Chart und sendet Warnungen, wenn der Preis eine Zone erreicht oder durchbrochen hat. Es ist auch möglich, es zu verwenden, um über reguläre doppelte Tops/Bottoms anstelle von Zonen benachrichtigt zu werden. Es ist möglich, RSI-, Volumen- und Divergenzfilter zu verwenden, um nur die stärksten Setups herauszufiltern. In Kombination mit Ihren eigenen Regeln und Techniken ermöglicht Ihnen dieser Indikator, Ihr eigenes leistungss
Dark Sprint MT5
Marco Solito
5 (2)
Dark Sprint  is an Indicator for intraday trading. This Indicator is based on Trend Following  strategy, also adopting the use of the atr to determine the right volatility. We can enter in good price with this Indicator, in order to follow the strong impulse on the current instrument. Key benefits Easily visible sprint lines Intuitive directional arrows Automated adjustment for each timeframe and instrument Easy to use even for beginners Never repaints, never backpaints, Not Lag 100% compati
I recommend you to read the   product's blog  (manual) from start to end so that it is clear from the beginning what the indicactor offers. This multi time frame and multi symbol trend indicator sends an alert when a strong trend or trend reversal has been identified. It can do so by selecting to build up the dashboard using Moving average (single or double (both MA:s aligned and price above/below both)), RSI, Bollinger bands, ADX, Composite index (Constance M. Brown), Awesome (Bill Williams), 
ACB Breakout Arrows MT5
KEENBASE SOFTWARE SOLUTIONS
5 (1)
The ACB Breakout Arrows indicator provides a crucial entry signal in the market by detecting a special breakout pattern. The indicator constantly scans the chart for a settling momentum in one direction and provide the accurate entry signal right before the major move. Get multi-symbol and multi-timeframe scanner from here - Scanner for ACB Breakout Arrows MT 5 Key features Stoploss   and Take Profit levels are provided by the indicator. Comes with a MTF Scanner dashboard which tracks the br
Features All Ichimoku Signals (Selectable) : Display all reliable signals generated by the Ichimoku indicator. You can choose which signals to view based on your preferences. Filter by Signal Strength : Sort signals by their strength—whether they are weak, neutral, or strong. Live Notifications : Receive real-time notifications for Ichimoku signals. Transparent Cloud : Visualize the Ichimoku cloud in a transparent manner. Available Signals Tenkensen-Kijunsen Cross Price-Kijunsen Cross Pri
PipFinite Trend Laser MT5
Karlo Wilson Vendiola
3 (3)
The Pioneer Of Trend Detection! A Powerful Indicator That Avoids Whipsaws And Uncertain Market Noise. Functions mainly as a filter to help you trade in the direction of the trend. It works in any pair or timeframe. Features Advanced trend detection software using complex algorithms that can be used as the supporting tool or system. Unique trend detection that avoids whipsaws and uncertain market noise Analyzes statistics of maximum profits and calculates possible targets for the next signal Fl
VolumeProfile MT5
Robert Hess
3.75 (8)
Beschreibung: Das Volumen Profil zeigt detailierte Informationen von historischen trading Aktivitäten in bestimmten Preisbereichen (Markt Profil/Preis Profil).  Damit finden Sie die Zonen mit den besten Preisen im Markt und erlangen so einen entscheidenen Vorteil gegenüber anderen Marktteilnehmern. Support: Der Indikator wird stetig weiterentwickelt und verbessert (siehe "Versionen"). Ich bin sehr dankbar für jeden Bericht von aufgetretenen Fehlern, sodass ich den Indikator verbessern kann. Bi
MonsterDash Harmonics Indicator is a harmonic pattern dashboard. It recognizes all major patterns. MonsterDash is a dashboard that displays all detected patterns for all symbols and (almost) all timeframes in sortable and scrollable format. Users can add their own user defined patterns . MonsterDash can open and update charts with the pattern found. Settings MonsterDash's default settings are good enough most of the time. Feel free to fine tune them to your needs. The color settings are for th
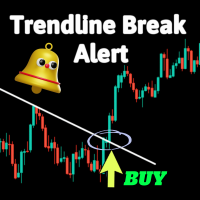
Dies ist ein einfacher Indikator, der eine Warnung bei Durchbrüchen von Trendlinien liefert. Er kann nützlich sein, wenn Sie es gewohnt sind, Trendlinien in Ihrem Handel zu verwenden. Einstellbare Parameter umfassen: Kerzenidentifikator: bei welcher Kerze nach einem Durchbruch ein Signal gegeben werden soll Und drei Arten von Warnungen: E-Mail senden Hörbare Warnungen Push-Benachrichtigungen Für Testzwecke empfehlen wir die Verwendung von MetaTrader 4 anstelle des Strategietesters von MetaT
This is diamond! Diamond Pattern is based on Read The Market(RTM) concepts. The purpose of this model is to face the big players of the market (financial institutions and banks), As you know in financial markets, big traders try to fool small traders, but RTM prevent traders from getting trapped. This style is formed in terms of price candles and presented according to market supply and demand areas and no price oscillator is used in it. RTM concepts are very suitable for all kinds of inves
Der Indikator besteht aus zwei Teilen. Teil I: Farbkerzen zeigen den großen Trend Farbkerzen dienen dazu, den Marktzustand anhand von Farbkerzen zu identifizieren. Wie in den Screenshots gezeigt, befindet sich der Markt in einem Zustand, in dem Sie Long-Orders platzieren oder Short-Orders beenden sollten, wenn die Farbe Aqua ist. Wenn die Farbe Tomate ist, ist es an der Zeit, Short-Orders aufzugeben oder Long-Orders zu beenden. Wenn sich die Farbe ändert, ist es besser, auf den Abschluss zu wart
Der Multi-Oscillator ist das ultimative Schweizer Taschenmesser für den Handel mit mehreren Währungen und Zeiträumen. Es zeichnet Ihren gewünschten Oszillator für viele Währungspaare und / oder Zeiträume in einem einzigen Diagramm auf. Es kann zum Handel mit statistischer Arbitrage, als Marktscreening-Tool oder als verfeinerter Multi-Timeframe-Indikator verwendet werden. [ Installationsanleitung | Update-Anleitung | Fehlerbehebung | FAQ | Alle Produkte ] Einfache Interpretation und Konfiguratio
Algo Map
Kenny Michael Smith
5 (3)
ALGO-KARTE MERKMALE - EINSTIEGSSTUFE - ÜBERNEHMEN SIE GEWINNSTUFEN - REVERSAL-EINTRAGSPUNKTE - UMKEHRSTRATEGIE - TREND-TRADING-STRATEGIE - KAUFEN UND VERKAUFEN SIE SWING-HANDELSSIGNALE IN JEDEM ZEITRAHMEN DIE BESTE HANDELSSOFTWARE SCHLÄGT MIT DIESER MT5-SOFTWARE JEDEN MARKT, JEDEN TAG! WOLLEN SIE AN PROP-FIRMEN PASSIEREN, ALGO MAP IST PROP-FIRMENFREUNDLICH! Sie sind neu im Handel und möchten eine Strategie, die langfristig funktioniert? Nutzen Sie unsere in Algo Map integr
CCI Multi Dashboard MT5
Andrew Ingosi Likare
5 (1)
The CCI Trend Dashboard is an advanced technical analysis tool available that provides a dashboard interface for traders to analyze multiple symbols and timeframes at once. It uses the Commodity Channel Index (CCI) in combination with currency strength and volumes to analyze market trends. The tool is user-friendly and suitable for both beginner and advanced traders. Note:  The values are derived from the CCI values of the respective symbol and timeframe using the specified period from the sett
ZigZag Lines MTF for MT5
Taras Slobodyanik
5 (7)
Multi timeframe ZigZag indicator. It displays the support/resistance horizontal lines and their breakouts, as well as draws the current targets of the market. It can also display lines of the Fractals indicator and candles from other periods (up to Quarterly).  The indicator redraws the last (current) point, and in some cases can change the last 2-3 points. All lines are drawn as objects (not indicator buffers, but there is a possibility to receive the data for the EA ). When used in an Exp
Ultimate Trend Trader MT5
Thibauld Charles Ghislain Robin
Embrace the Power With Ultimate Trend Trader Indicator. Facing the reality of individual traders, we are far from harnessing the capabilities of AI and high-frequency trading algorithms that dominate today's markets. Without access to massive data centers or infrastructure to compete on microseconds, the battle seems skewed. Yet, the true advantage lies not in technological arms but in leveraging human intellect to outsmart the competition. The Ultimate Trend Trader Indicator embodies this appr
Orders Indicator MT5
Andrey Khatimlianskii
5 (1)
i-Orders is a simple indicator to monitor your own trade/analyze others' trades. I use it for a long time and do not imagine a chart without these arrows, lines and trade result numbers. The features allow you to: change the size and location of the control buttons ( Control buttons size , Control buttons corner ), disable display of opened and closed positions ( Show OPENED , Show CLOSED , Show PENDING ), change colors of arrows and lines for profitable and unprofitable buy and sell positions s
** All Symbols x All Time frames scan just by pressing scanner button ** *** Contact me after the purchase to send you instructions and add you in "Harmonic Scanner group" for sharing or seeing experiences with other users. Introduction Harmonic Patterns are best used to predict turning point. Harmonic Patterns give you high win rate and high opportunities for trade in during one day. This indicator detects the best and successful patterns based on Harmonic Trading concepts . The   Harmonic Patt
SMARTMASS INDICATOR This indicator is different from all known volume indicators. It has a significant distinction; it is an algorithm that relates price movement to volume, attempting to find proportionality and efficient movement while filtering out noise and other movements that are more random and do not follow a trend or reversal. Ultimately, it reveals the true strength of the movement, indicating whether it has genuine support from bulls or bears or if it's merely a high-volume movemen
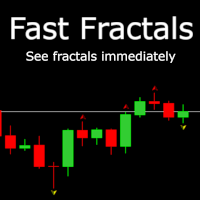
Info: It's like built in Fractals indicator but faster. Usually it shows the signal after 2 bars but FastFractals indicator shows signals immediately and that's is incredible. You can create scalp strategies with it or trade yourself. This indicator uses neural network to analyze price graph and predict. It was trained on 4 hours interval on EURUSD pair, but you can use it with different periods and instruments. There is only one minus in this indicator, it hasn't got 100% accuracy. See pictures
If You Are Discretionary Trader This Tool Is A Must Chart Switcher ------> Linking Multi-Time Frame Charts / Syncing Indicators And Drawings. Main USP Of This Indicator: Is Opening Multi-Time Frame Multiple Charts {Up To 10 Charts} Of A Symbol With Just 1 Click. You Do not Have To Save Any Template As It has Been Save Auto When You Click Same Symbol Or Move To Another Symbol.   It Is Divided Into 2 Parts: 1}  COMMON MODE  and 2}  SYMBOL MODE   1} COMMON MODE: Under This Mode, You Can Sync Commo
Introducing the Order Block Indicator , the pinnacle of trading technology. Order blocks, the large cluster of buy or sell orders placed by institutional traders, significantly influence market direction. They form at critical price levels and can act as robust support and resistance zones. Our cutting-edge indicator allows you to harness the full potential of these influential market dynamics, providing a never-before-seen level of precision and customization. Here's why this tool stands apart:
Start Vwap Custom Midas
Ricardo Almeida Branco
5 (3)
Attention: New update - 4 major practicality improvements! 1) Alarm 2) Midas text value 3) Click panel 4) Can be connected to an EA to operate in semi-automatic mode Attention - This indicator does not work perfectly in backtest due to MT5 peculiarities (Reading hotkeys or panel clicks) . My suggestion is that you test Automatic Vwap Midas which has automatic operation to analyze the calculation and then buy Start if you think the indicator will match your operating.     This indicator i
Fractal Reverse MTF
Andrii Diachenko
5 (1)
Fractal Reverse MTF - Indicator for determining the fractal signal to change the direction of the trend for МetaТrader 5. The signal is determined according to the rules described in the third book of B. Williams: - In order to become a signal to BUY, the fractal must WORK ABOVE the red line - In order to become a signal for SALE, the fractal must WORK BELOW the red line -  Signals are not redrawn/ not repainting The main idea of ​​the indicator: - Determine the change in the directio
M & W Pattern Pro is an advanced scanner for M and W patters , it uses extra filters to ensure scanned patterns are profitable. The indicator can be used with all symbols and time frames. The indicator is a non repaint indicator with accurate statistics calculations. To use , simply scan the most profitable pair using the statistics dashboard accuracy , then enter trades on signal arrow and exit at the TP and SL levels. STATISTICS : Accuracy 1 : This is the percentage of the times price hit
This indicator scans for you up to 15 trading instruments and up to 21 time frames for occurrences of the high probability reversal patterns: Double Tops/Bottoms with fake breakouts . What this indicator detects: This indicator detects a special form of Double Tops and Bottoms, so called Double Tops/Bottoms with fake breakouts . For double tops with fake breakouts the highest price of the right shoulder must be higher than the left shoulder. For double bottoms with fake breakouts the lowest pric
Crash Spike Master
Dawid Aaron Zinserling
Crash Spike Master ist die Zukunft für den Handel mit Crash-Märkten. Es wurde entwickelt, um auf den Crash-Märkten 300, 500 und 1000 im 1-Minuten-Zeitrahmen zu laufen. Es hat 2 verschiedene Handelsmodi (Aggressiv und Normal). Der Aggressive Modus wird gelbe und blaue Pfeile zeichnen. Es gibt 2 verschiedene Bedingungen, um Ihnen bei der richtigen Entscheidung zu helfen. Geben Sie den ersten Trade beim gelben Pfeil ein und den zweiten Trade bei der blauen Kerze. Der Stop-Loss (SL) in diesem Modus
PipFinite Impulse PRO MT5
Karlo Wilson Vendiola
5 (13)
Are You Tired Of Getting Hunted By Spikes And Whipsaws? Don't become a victim of the market's erratic moves.. Do Something About It! Instantly make smarter decisions with Impulse Pro's precise balance of filters and accurate statistics. Timing Is Everything In Trading To learn more, please visit www.mql5.com/en/blogs/post/718212 Anticipate the next big move before it unfolds in 3 Simple Steps! Advantages You Get Early impulse detection algorithm. Flexible combination to different tr
Mega Dashboard
Paul Anscombe
5 (2)
Create Unlimited Dashboards Each dashboard can be upto 28 Symbols x 24 Indicators. Mix and match from 31 leading indicators and all timeframes, to create unlimited unique dashboards. Create Group Alerts to be alerted when your chosen indicators are all aligned. 33 customizable trading strategy alerts (Trend, Breakout, Overbought, Oversold, Thresholds, Saucers etc). Scalper, Day or Long Term Trader?  Mega Dash has you covered, design your unique dashboard to suit your trading style. Mega Dash is
The intention of the dashboard is to provide a quick overview of the daily, weekly and monthly range of configured assets. In "single asset mode" the dashboard shows you possible reversal points directly in the chart, thus making statistics directly tradable. If a configured threshold is exceeded, the dashboard can send a screen alert, a notification (to the mobile MT5) or an email.  There are various ways of using this information. One approach is that an asset that has completed nearly 100% o
This indicator converted from 5 min Buy and Sell Range Filter - guikroth version on TradingView Popularity of the Range Filter The Range Filter is a very popular and effective indicator in its own right, with adjustments to the few simple settings it is possible to use the Range Filter for helping filter price movement, whether helping to determine trend direction or ranges, to timing breakout or even reversal entries. Its practical versatility makes it ideal for integrating it's signals into
"Pattern 123" is an indicator-a trading system built on a popular pattern, pattern 123. This is the moment when we expect a reversal on the older trend and enter the continuation of the small trend, its 3rd impulse. The indicator displays signals and markings on an open chart. You can enable/disable graphical constructions in the settings. The indicator has a built-in notification system   (email, mobile terminal, standard terminal alert). "Pattern 123" has a table that displays signals fr
Quantum Tick Volumes Indicator for MT5
QUANTUM TRADING SOFTWARE LIMITED
5 (1)
Many Forex traders assume there is no volume in the foreign exchange market. And they would be correct. There is no central exchange, not yet anyway. And even if there were, what would it report? What there is however is activity, and this is captured as tick volume. After all, volume is simply displaying activity, the buyers and sellers in the market. So for volume read activity, and for activity read volume – simple. The MT5 platform delivers tick data which the Quantum Tick Volumes indicator
Key level breaker block MT5
Presley Annais Tatenda Meck
5 (1)
The key level breaker block indicator automatically draws breaker blocks for you on the chart. Breaker blocks are, in short, failed order blocks, but create strong support and resistance zones when price comes back to re-test them. Advantages  The key level breaker block DOES NOT RE-PAINT, giving you confidence when a signal appears and also helps when looking back.  The key level breaker block includes an on/off button on the chart to easily keep the charts clean after analysis by just on
Key level wedge MT5
Presley Annais Tatenda Meck
The   Key level wedge MT5   indicator automatically draws rising wedge pattern and falling wedge pattern for you on the chart. This pattern is really good when used as a confirmation entry at key support & resistance, supply & demand and reversal zones. Advantages  The   Key level wedge MT5   block DOES NOT RE-PAINT, giving you confidence when a signal appears and also helps when looking back.  The   Key level wedge MT5   includes an on/off button on the chart to easily keep the charts cle
Ein Kopf-Schulter-Muster ist eine Diagrammformation, die einer Grundlinie mit drei Spitzen ähnelt, wobei die beiden äußeren in der Höhe nahe beieinander liegen und die mittlere am höchsten ist. Es prognostiziert eine zinsbullische Trendumkehr und gilt als eines der zuverlässigsten Trendumkehrmuster. Es ist eines von mehreren Topmustern, die mit unterschiedlicher Genauigkeit signalisieren, dass ein Trend sich seinem Ende nähert. [ Installationsanleitung | Update-Anleitung | Fehlerbehebung | FAQ
Das Cup and Handle-Muster ist eine technische Preisbildung, die an einen Cup und einen Henkel erinnert, wobei der Cup die Form eines "U" hat und der Henkel leicht nach unten abweicht. Die rechte Seite des Musters - der Griff - ist kleiner als die linke Seite - die Tasse - und zieht sich von oben nicht mehr als 50% zurück. Es kann sowohl ein Fortsetzungs- als auch ein Umkehrmuster sein. [ Installationsanleitung | Update-Anleitung | Fehlerbehebung | FAQ | Alle Produkte ] Klare Handelssignale Anpas
The indicator displays the key support and resistance levels on the chart. The significance of these levels lies in that the price may reverse or strengthen the movement when passing such levels, since they are formed as a consequence of the natural reaction of market participants to the price movement, depending on which positions they occupied or did not have time to occupy. The psychology of the level occurrence: there always those who bought, sold, hesitated to enter or exited early. If the
Traders Dynamic Index (TDI) MetaTrader indicator  — a comprehensive but helpful indicator that uses   RSI   (Relative Strength Index), its   moving averages, and volatility bands (based on   Bollinger Bands) to offer traders a full picture of the current Forex market situation. Here is single timeframe product. Once puscharse this indicator, you free to use MTF scanner (free at here ) The Traders Dynamic index TDI indicator is the next generation of the popular Trader Dynamic index indicator dev
Support Resistance View draws horizontal lines in the current chart that define in real time the values of Supports/Resistances for the timeframe tha you choose. Inputs: Lines color: color of the lines. Timeframe: timeframe for calculations. Support and Resistance are values at which the currency usually inverts the trend or have a breakthrought, so you can use this values to define a strategy for trading.
Multi-currency and multitimeframe Heikin Ashi indicator. Shows the current state of the market. On the scanner panel you can see the direction, strength and number of bars of the current trend. The Consolidation/Reversal candles are also shown using color. You can specify any desired currencies and periods in the parameters. Also, the indicator can send notifications when the trend changes or when reversal and consolidation candles (dojis) appear. By clicking on a cell, this symbol and period wi
Quarterly Cycles
Barend Paul Stander
Quarterly Cycles Quarterly Cycles is based on the Quarterly Theory developed by Daye (  traderdaye on X / Twitter).     This is an aid to the user to find Cycles and it is NOT automatic detected, user can select AMDX or XAMD  in each Cycle and it will be visually draw on the chart.   Quarterly Cycles:   Yearly, Monthly, Weekly, Daily, 6 Hour (90 minutes) – Yearly Cycle: The year is divided in four sections of three months each Q1 - January, February, March Q2 - April, May, June Q3 - Jul
Der Indikator „Supertrend MetaTrader 5“ ist die Grundlage des einfachsten Trendhandelssystems. Und doch bleibt es sehr effektiv. Der Indikator funktioniert in jedem Zeitrahmen (im Zeitrahmen des aktuellen Charts). Aus dem Namen können Sie ersehen, dass dieser Indikator dem Trend folgt, und wenn sich der Trend ändert, zeigt der Indikator genau den Punkt der Trendänderung an. Die Grundlage von „Supertrend MetaTrader 5“ ist der Vergleich von Preis- und „Average True Range Indicator“-Werten multipl
Pro Sessions MT5
Taras Slobodyanik
5 (1)
This is an indicator of trading sessions  that can display all levels (Open-High-Low-Close) for four sessions . The indicator can also predict session levels. Sessions can be drawn with lines or rectangles (empty or filled), lines can be extended to the next session. You can easily hide/show each session by pressing hotkeys (by default '1', '2', '3', '4'). You can see ASR (Average Session Range) lines  (default hotkey 'A'). This is similar to the ADR calculation, only it is calculated based on
50% off. Original price: $60   (Ends in May 15th) Support and Resistance zones indicator for MT5 is a multi-timeframe panel and alert that finds support and resistance zones and pivot points for all timeframes of MetaTrader 5 and gives alert when price has interaction with them. Download demo version (works on GBPUSD, EURJPY and NZDUSD symbols) Read the full description of scanner parameters in the blog page . Many unique features in one indicator: Integrating support and resistance zones and p
Easy Channels MT5
Alexander Nikolaev
5 (1)
Dieser Indikator zeichnet Preiskanäle. Einfach zu verwenden. Es hat verschiedene Einstellungen, zum Beispiel können Sie es so konfigurieren, dass Kanäle nur zum Kaufen oder Verkaufen angezeigt werden. Sie können Trendlinien anstelle von Kanälen anzeigen. Es gibt viele Handelsstrategien, die auf dem Handel mit Kanälen basieren. Sie können beim Rebound von den Grenzen der Kanäle oder beim Zusammenbruch des Kanals handeln.   Parameter Verlauf - die maximale Anzahl von Balken zum Erstellen von Kanä
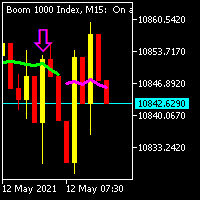
Nemesisfx boom and crash
Shandrey Naswil Petersen
trade boom and crash with trend arrows no repaint arrows direction of use  if you buy boom stoploss below arrow  if you sell crash stoploss above arrow please note that you need to follow trend to have perfect trades only use on m15   allow candles to close before taking trades please make sure you find this indicator useful as it has a 80% win rate on m15 h1 and h4 make good trades
Hello Seasonal Traders! The seasonality trading strategy works because the smart money is doing the same thing every single year more often than not. The month of the year or the day of the week and the time of the day can call the shots in any market.   The seasonal cycle is another useful tool in your trading arsenal. I'm not saying to trade solely off of seasonality and forget anything else. I'm only giving you another trading tool that you can incorporate into your own trading strategy to ga
Buy Sell Volatility 75
Ignacio Agustin Mene Franco
Pack Volatility 75 1/3 In this indicator stage 1 I am pleased to present you the volatility 75 Buy/Sell Professional indicator. where in each temporary structure it will mark a sale and a safe purchase to operate manually, where the strategy is based on the lines EMA of 7 exponential periods and the EMA of 50 exponential periods. where purchasing a product comes 2 as a gift (it's the pack) purchasing any of the 3 products will be sent the remaining indicators, to be able to apply the strategy we
Let us introduce you to a new era of neural indicators for financial markets! Intelligent Moving is a unique indicator that trains its neural network in real time! You no longer need to look for the optimal indicator parameters for each specific situation. No more late signals. The artificial intelligence is able to adapt itself and predict any market movements. Visually, the indicator is drawn as a main solid moving average line, two dotted lines of standard deviations and signal arrows. For
DSignal for "Brent" is a new indicator for buying and selling in MetaTrader 5. This is a simple indicator that shows market entry points. Perfect for both beginners and professionals. Recommended time frame is H1. Recommended financial instrument for trading is Brent oil. Work with 4-digit and 5-digit quotes. Never repaints signal. Features A market entry is possible at the close of H1 candlestick if the indicator draws an arrow (sell when crimson, buy when blue). Never repaints signal. Indica
The order block locator is powered by three main search algorithms thar can be used to find order blocks. Simple Fractal Search Algorithm Naive Fractal Movers Algorithm Candle Transition Algorithm You can even combine the power of your 2 favourite algorithms and get the best of both worlds: Mixed Algorithm (Naive Fractal + Candle transition) Mixed Algorithm (Simple Fractal + Candle Transition Simple Fractal Search Algorithm The algorithm finds the fractals based on your setting paramers fo
It predicts the most likely short-term price movement based on advanced mathematical calculations. Features Estimation of immediate price movement; Calculation of the real market trend; Calculation of the most important support and resistance levels; Algorithms optimized for making complex mathematical calculations with a minimal drain of system resources; Self-adjusting for better performance, so it’s able to work properly at any symbol (no matter how exotic it is) and any timeframe; Compatib
Market Imbalance MT5
Scott Edward Merritt
What Is Market Imbalance? Market Imbalance, also known as "IPA" or Improper Price Action, is when price moves so quick in one direction with no orders on the other side of the market to mitigate the price movement. We all know Big Banks, or "Smart Money", can move the market by placing huge orders which in turn can move price significantly. They can do this because Big Banks are the  top 10 Forex traders in the world . But unfortunately, the Big Banks cannot leave these orders in drawdown and mu
Introduction to Harmonic Pattern Scenario Planner The present state of Forex market can go through many different possible price paths to reach its future destination. Future is dynamic. Therefore, planning your trade with possible future scenario is an important step for your success. To meet such a powerful concept, we introduce the Harmonic Pattern Scenario Planner, the first predictive Harmonic Pattern Tool in the world among its kind. Main Features Predicting future patterns for scenari
I recommend you to read the  product's blog  (manual) from start to end so that it is clear from the beginning what the indicator offers. This multi time frame and multi symbol supply and demand zone dashboard indicator sends alerts when the price has reached a supply/demand zone. It is also possible to use it to be alerted about regular double tops/bottoms instead of zones. It can be used with all time frames from M1 to MN. Maximum 9 time frames can be shown in the dashboard at the same time. 
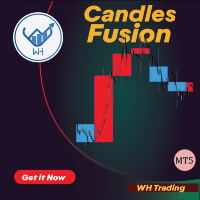
Candles Fusion ist ein leistungsstarker   MT5-   Indikator, der Ihre Handelsanalyse verbessert, indem er Kerzen mit höherem Zeitrahmen im aktuellen Zeitrahmen anzeigt. Diese einzigartige Funktion bietet Händlern einen umfassenden Überblick über die Preisbewegungen über verschiedene Zeiträume hinweg und ermöglicht es ihnen, fundiertere Handelsentscheidungen zu treffen. Merkmale: Überlagerung mehrerer Zeitrahmen. Anpassbare Zeitrahmenauswahl. Klare Visualisierung.  Echtzeit-Updates.  Benutzerfr
Der   Accurate Gold -Indikator ist ein benutzerfreundliches Tool, das unabhängig vom Erfahrungsniveau der Trader intuitiv und einfach zu bedienen ist. Er wurde für Trader entwickelt, die präzise Signale im M5-Zeitrahmen auf dem Goldmarkt suchen. Dieser Indikator verwendet fortschrittliche mathematische Algorithmen, um Preisbewegungen und Volumendynamiken zu analysieren und genaue Kauf- und Verkaufssignale zu generieren. Die besonderen Merkmale dieses Indikators, einschließlich seiner nicht neuze
Scalper Assistant MT5
Pavel Verveyko
3.67 (3)
The indicator is a trading system for short-term trading. Scalper Assistant helps to determine the direction of the transaction, and also shows the entry and exit points. The indicator draws two lines (possible points for opening positions). At the moment of the breakdown of the upper line up (and when all trading conditions are met), an up arrow appears (a buy signal), as well as 2 goals. At the moment of the breakdown of the lower line down (and when all trading conditions are met), a do
The Angle Prices indicator is a tool that calculates the price angle based on price analysis, interpreting the time vector in the form of price points on the price chart. In other words, the X axis and Y axis are represented as price points, so you can actually calculate the angle with two axes of the same dimension. This allows traders to obtain information about the direction of price movement and possible entry or exit points for trades. Let's look at the main characteristics and interpretat
MTF Candles PRO
Renato Fiche Junior
1 (2)
Tool that allows viewing candles in multiple timeframes. This way, it helps the analysis in multiple timeframes. This is another product developed by Renato Fiche Junior and available to all MetaTrader 5 users! Input Parameters - Option 1 - TimeFrame: Standard MT5 timeframe - Option 2 - Custom TimeFrame (in minutes): Or, if this value is different from zero, the timeframe will be customized. This allows you to choose timeframe other than the MT5 standard. - Total Candles: Number of candle
Fügen Sie diesen Indikator zum Diagramm hinzu und stellen Sie die ExtDepth-Einstellung von ZigZag ein Es gibt eine sofortige Warnung, wenn der Preis den oberen, unteren oder mittleren Kanal der Trendlinie berührt Merkmale : -Aktivieren / Deaktivieren von Warnungen in der oberen, unteren oder mittleren Zeile - Fügen Sie eine Pause nach einer Warnung in Sekunden hinzu - Trendkanal anhalten oder fortsetzen mit Schaltfläche auf dem Diagramm - Fügen Sie Frühwarnungen hinzu, indem Sie Punkte im
Real xRSI
Amir Mohammadreza Mikaniki
5 (1)
Suchen Sie nach einem leistungsstarken Indikator, um Ihr Trading auf die nächste Stufe zu heben? Suchen Sie nicht weiter als nach unserem einzigartigen RSI-basierten Indikator, der das Beste aus dem Relative Strength Index (RSI), dem gleitenden Durchschnitt und den Heiken-Ashi-Indikatoren in MQL5 kombiniert. Unser Indikator bietet Echtzeitdaten ohne Verzögerung, sodass Sie mit Zuversicht fundierte Handelsentscheidungen treffen können. Es ist perfekt für Händler aller Niveaus, vom Anfänger bis
Dual Impulse
Clemence Benjamin
Dies ist ein mechanisch gestalteter Indikator, der auf der Candlestick-Preisbewegung basiert. Es funktioniert mit jedem beliebigen Handelsinstrument und erzeugt Warnungen, wenn ein Kauf- oder Verkaufsimpuls erzeugt wird. Es gibt jedoch ein Video und erklärende Dokumente zur Validierung von Signalen, die auch Einstiegs- und Ausstiegstechniken bereitstellen. Suchen Sie auf YouTube nach BenJC Trade Advisor und finden Sie Erklärvideos zu diesem Produkt. Die neueste Version verfügt über Trend- und
Time And Sales Layout indicator shows traded buy and sell volumes right on the chart. It provides a graphical representation of most important events in the time and sales table. The indicator downloads and processes a history of real trade ticks. Depending from selected depth of history, the process may take quite some time. During history processing the indicator displays a comment with progress percentage. When the history is processed, the indicator starts analyzing ticks in real time. The l
KT Schaff Trend Cycle MT5
KEENBASE SOFTWARE SOLUTIONS
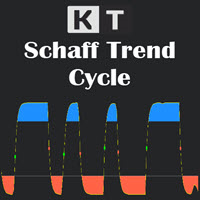
The Schaff Trend Cycle (STC) is a technical analysis tool that helps traders and investors plot highly-probable predictions on the price direction of an instrument. Due to its predictive properties, It's a good tool for foreign exchange (forex) traders to plot buy and sell signals. The Schaff Trend Cycle was developed by prominent forex trader and analyst Doug Schaff in 1999. The idea driving the STC is the proven narrative that market trends rise or fall in cyclical patterns across all time fr
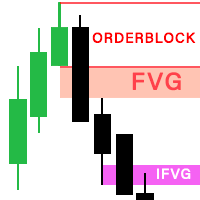
The latest version 2.0 of the FVG Indicator is fully integrated into an all-in-one package, including: Fair Value Gaps (FVG). See more =>  How to trade with FVG Implied Fair Value Gap (IFVG). See more => How to trade with IFVG OrderBlock (OB). See more => How to trade with OrderBlock The options in the settings section are relatively easy to navigate, and you can even use them right away upon activation without encountering difficulties when using the default configuration. The indicator utilize
MP Colored MACD for MT5
Pierre Ksachikian
5 (1)
MACD (short for   M oving   A verage   C onvergence/ D ivergence) is a popular trading indicator used in technical analysis of securities prices. It is designed to identify changes in the strength, direction, momentum, and duration of a trend in a security's price. History Gerald Appel created the MACD line in the late 1970s. Thomas Aspray added the histogram feature to Appel's  MACD in 1986. The three major components and their formula 1. The MACD line: First, "PM Colored MACD" employs two
The Reversal Strategy
Kenny Michael Smith
5 (1)
Entdecken Sie die ultimative Umkehrhandelsstrategie! Wir stellen einen leistungsstarken Indikator vor, der die Kunst eröffnet, Umkehrungen in jeder Handelssitzung zu erkennen. Verabschieden Sie sich vom Rätselraten und begrüßen Sie die Präzision! Unser Indikator bildet sowohl die Buy-Side-Liquidität (BSL) als auch die Sell-Side-Liquidität (SSL) sorgfältig ab und stattet Sie mit dem Wissen aus, um fundierte Ausstiegsentscheidungen zu treffen. Aber das ist noch nicht alles – mit
Der Indikator identifiziert, wenn eine Divergenz zwischen dem Preis und einem Oszillator/Indikator auftritt. Es identifiziert sowohl reguläre als auch versteckte Abweichungen. Es verfügt über eine RSI-Filteroption, die es ermöglicht, nur die stärksten Setups herauszufiltern. Der Indikator bietet auch Optionen zum Warten auf eine Engulfing-Formation, den Ausbruch des Donchian-Kanals oder bis der Preis einen gleitenden Durchschnitt überschreitet   (siehe Screenshot Nr. 3).       um die Divergenz z

Der MetaTrader Market ermöglicht, Programme für die MetaTrader Plattform sicher zu kaufen. Sie können Demoversionen gewünschter Roboter und Indikatoren direkt im Terminal herunterladen und diese im Strategietester prüfen.

Testen Sie Programme in unterschiedlichen Modi vor dem Kauf, um eine Vorstellung vom Produkt zu bekommen, und bezahlen Sie das Produkt über das Zahlungssystem der MQL5.community.

Mit dem Zahlungssystem der MQL5.community kann man Produkte bezahlen und dank der Möglichkeit, das Produkt vor dem Kauf in verschiedenen Modi zu testen, können Kunden eine Vorstellung vom Produkt bekommen.